CPO Science
Physics Skill and Practice Worksheets
Stop wasting energy searching for physics resources, this comprehensive collection of worksheets has you covered. Starting with introductions to the scientific method, dimensional analysis, and graphing data, these skills practice...
Learning Games Lab
Scientific Graph Reading
Interpreting graphs is an essential skill for young scientists. An interactive online lesson gives individuals an opportunity to review the components of a graph and learn to read and interpret the shape of a graph. The lesson includes...
Curated OER
Student News And Weather Channel
Fabulous! Your 5th graders should love this project. As an ongoing lesson throughout the year students use temperature probes to record outside temperature and then document their data using spreadsheets. They use their weather data and...
Beyond Benign
Water Bottle Unit
How much plastic do manufacturers use to create water bottles each year? The class explores the number of water bottles used throughout the years to determine how many consumers will use in the future. Class members compare different...
Learning Games Lab
The Magic of Reading Graphs
Making conclusions from graphs doesn't need to seem like magic. Learners explore an interactive lesson on reading graphs to strengthen their skills. The content discusses how to read the axes of a graph and draw conclusions based on the...
Howard Hughes Medical Institute
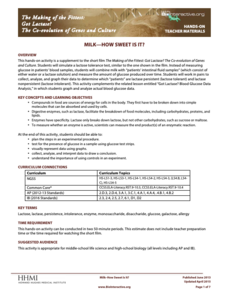
Milk—How Sweet Is It?
Have you ever wondered why some people are lactose intolerant? Participants test simulated patients in a hands-on lab activity to find out! They learn about lactose intolerance by performing an experiment, analyzing data, and drawing...
Curated OER
Energy Audit
Students collect data about energy usage and use mathematical calculations to analyze their data. In this energy conservation and statistics math lesson plan, students survey their homes to complete an energy usage worksheet. Students...
Curated OER
ACT Science Reasoning Test
The types of scientific information that need to be analyzed in the ACT test are presented here. Tips and techniques for completing the research, data, viewpoints, and multiple choice questions will help your class and their expectations.
Curated OER
Careers in Science
Students learn the trends in the current job market for scientists,
find where the jobs are, the range of salaries, and the job requirements.
They discover that scientists do some very interesting things, then
write a letter of...
Curated OER
What's Cooking?
Students investigate solar energy by making sun tea. In this ecology and solar energy lesson, students prepare traditional tea and "sun" tea, then record and graph data comparing color, clarity, smell and taste.
Curated OER
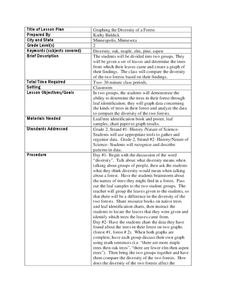
Graphing the Diversity of a Forest
Second graders work in groups to identify what types of trees create which types of leaves In this plant life lesson plan, 2nd graders analyze a set of leaves and identify the tree it came from while graphing the data in a science...
Curated OER
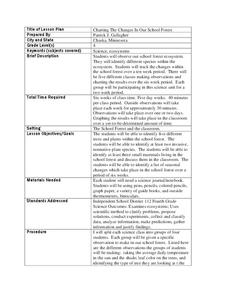
Charting the Changes in Our School Forest
Fourth graders investigate the ecosystem and how forests are disappearing. In this environmental protection lesson, 4th graders analyze the changes in their school for 2 weeks. Students practice identifying trees, birds, and...
CK-12 Foundation
Flashlight
In a simple circuit, does electricity start instantly? A simulation encourages thinking about the flow of electrons at a microscopic level. Pupils control the voltage, resistance, and switch in order to observe the change in both ideal...
Curated OER
Effects of chemical use in Agriculture
Students research environmental data to create a bar graph. In this agricultural ecology lesson, students research the pros and cons of chemical use in farming. Students debate on passing a law to reduce chemical use.
Curated OER
Back In The "Old Days"
Fifth graders collect data during their worker interviews while in groups to compile job changes. They analyze the data to determine the categories of changes, patterns/trends of change and future projections. Each group then develops a...
Curated OER
How Does Your Blue Bonnet Grow?
Students explore the conditions needed to grow Texas Blue Bonnets. In this Blue Bonnet planting activity, students recognize the differences in Texas Blue Bonnet. Students record their findings in a graphs and analyze their results.
Curated OER
Earth Energy Budget Pre Lab
Students explore energy by conducting an in class experiment. In this climate change activity, students conduct a water vapor experiment in a soda bottle. Students utilize graphs and charts to analyze the results of the experiment and...
Curated OER
IT IS ABOUT SUPPLY AND DEMAND.
Students learn that the price of an item is defined by its supply and demand. In this lesson students graph the relationship between demand and supply of various products, students also consider hidden costs.
Curated OER
Friends on the Farm
Young farmers explore the world of farm animals. They are introduced to a variety of animals, what their role is, how many legs they have, and what sounds they make. Worksheets and websites embedded in the plan are used to carry it out....
Beyond Benign
Product Test
It's the moment of truth. Previous lessons in the 24-part series had scholars design and develop shampoo formulas using chemical concepts. The 18th lesson asks them to test the function of their shampoos. To do this, they calculate the...
Curated OER
Household Conservation/Efficiency
Hook your class up to an online home energy usage calculator so that they can estimate the amount used per month by their families. Then give them Watt meters with which they will measure the power consumption of several small...
Curated OER
Energy Analysis
Students analyze information in graphs about U.S. energy consumption. In this energy consumption lesson, students create graphs and answer questions about U.S. energy consumption data. They determine trends in their graphs and research...
Teach Engineering
Energy on a Roller Coaster
Roll with your class into the idea of conservation of energy. Pupils use a roller coaster track to collect data to reinforce the concept of conservation of energy and the influence of friction. Class members then create a graph from...
National Research Center for Career and Technical Education
Hospitality and Tourism 1: Safety and Sanitation
Math and science come alive in this career-related instructional activity on sanitation. Along the way, learners explore bacterial growth rates using exponential notation and graphs. A link to a very brief, but vivid video shows just how...


