Hi, what do you want to do?
Math Graphs
Houghton Mifflin: Math Graphs: Slope of a Tangent Line 15 [Pdf]
The practice problem compares finding the slope of the tangent line graphically and analytically. The handout is available in PDF format.
Math Graphs
Houghton Mifflin: Math Graphs: Slope of a Tangent Line 16 [Pdf]
The practice problem compares finding the slope of the tangent line graphically and analytically. The handout is available in PDF format.
Math Graphs
Houghton Mifflin: Math Graphs: Direction and Vectors 1 [Pdf]
Learners are given the level curve of a function and are asked to sketch the vector showing the greatest rate of increase of the function. The practice exercise is available in PDF format.
Texas Instruments
Texas Instruments: Quotient Rule
This activity will use the capabilities of the graphing calculator to illustrate the symbolic derivative quotient rule.
Texas Instruments
Texas Instruments: Inverse of Two Temps
In this activity, students find a conversion equation that will calculate the corresponding Celsius temperature for any given Fahrenheit temperature. Students learn to graph scatter plots, analyze and graph linear equations, compute and...
Texas Instruments
Texas Instruments: Implicit Differentiation
In this activity, students can use the graphing calculator to find the derivative of an implicitly defined function.
National Council of Teachers of Mathematics
Nctm: Illuminations: Interactive Calculus Tool
Investigate graphs of polynomial functions, tangent lines, derivatives, and area under a curve with this interactive applet.
Texas Instruments
Texas Instruments: Implicit Differentiation on the Ti 89
This activity demonstrates implicit differentiation on the graphing calculator.
Other
Study.com: Critical Path Analysis
Critical path analysis is a project management tool used to understand task dependencies and their effect on the project schedule. In this lesson, we show how the critical path can be derived
Purple Math
Purplemath: Quadratic Word Problems: Projectile Motion
Launching a rocket up into the air, throwing a textbook down off a rooftop, or tossing a baseball out to someone in center field are all examples of projectile motion and quadratic word problems. Situations like these are explored here,...
Math2
Math2
This is a site for students and teachers of all grade levels. If you are looking for math tables, general information about math topics, or you would like to ask a question, this is the site to visit.
Ministry of Education and Universities of the Region of Murcia (Spain)
Ministerio De Educacion Y Ciencia: Problemas De Optimizacion
In Spanish. Apply your Calculus knowledge using interactive activities to solve optimization problems.
Interactive Mathematics
Interactive Mathematics: Differentiation
Explore the world of Calculus through differentiation. Focusing on areas such as limits, tangents to curves, and derivatives, this site shows you how to solve problems based on the discoveries of Sir Isaac Newton and Gottfried Leibniz....
Interactive Mathematics
Interactive Mathematics: Graphical Solution of Non Linear Systems
Using the graphing method, several systems of nonlinear equations are solved. Follow each example step by step to see how solutions are derived.
Interactive Mathematics
Interactive Mathematics: Curve Sketching
Sketches of functions are drawn by determing important points: x- and y-intercepts, local maxima and minima, and point of inflection. The general shapes of specific functions are illustrated to help identify characteristics of each type...
Wolfram Research
Wolfram Math World: Epicycloid
Shows how to graph them and also derives the polar equations from the parametric equation. The site then defines a few special Epiycloids. Includes a definition, formulas, graphs, video, and links to related topics.
OpenStax
Open Stax: Time, Velocity and Speed
In the following interactive module, students will begin to explain the relationships between instantaneous velocity, average velocity, instantaneous speed, average speed, displacement, and time. They will calculate velocity and speed...
Curated OER
A Firm Hires Until Wage = Mrp
A description, examples, and graphs on the subject of "derived demand" are provided.
Curated OER
A Shift in Mrp Changes Wage and Quantity
A description, examples, and graphs on the subject of "derived demand" are provided.
Texas Instruments
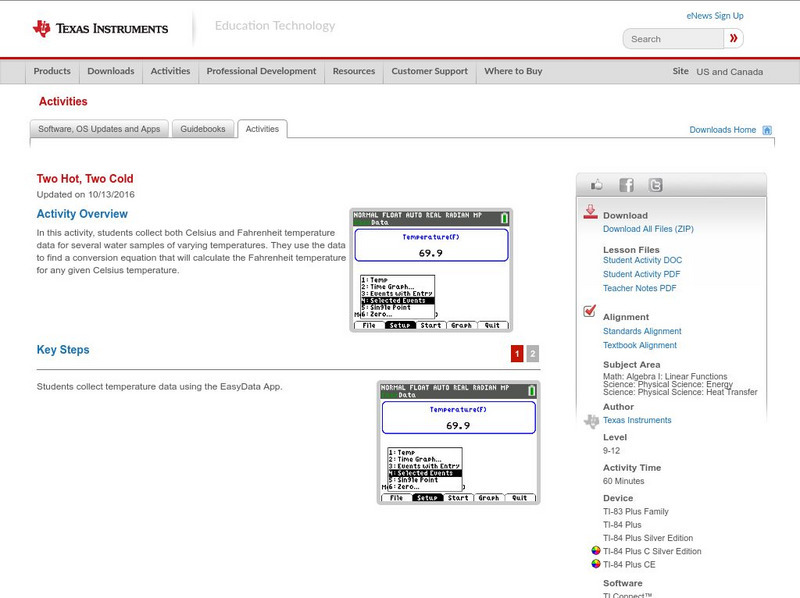
Texas Instruments: Two Hot, Two Cold
In this activity, students collect both Celsius and Fahrenheit temperature data for several water samples of varying temperatures. They use the data to find a conversion equation that will calculate the Fahrenheit temperature for any...
Khan Academy
Khan Academy: Analyze Functions (Calculator Active)
Analyze the behavior of graphs of functions using a graphing calculator and your knowledge about derivatives.
Texas Instruments
Texas Instruments: Integration Crossing
This worksheet allows the students the opportunity to learn how to use the graphing calculator to compute anti-derivatives.
Texas Instruments
Texas Instruments: The Remainder Theorem, Polynomial Expansion, and Tangent Line
In this Derive activity, students use the Remainder Theorem to find a tangent line to the graph of a polynomial function.


![Houghton Mifflin: Math Graphs: Slope of a Tangent Line 15 [Pdf] Unknown Type Houghton Mifflin: Math Graphs: Slope of a Tangent Line 15 [Pdf] Unknown Type](https://static.lp.lexp.cloud/images/attachment_defaults/resource/large/FPO-knovation.png)


