Curated OER
Match The Graph Circles
High Schoolers engage in a study of circles and graphs that are related with the focus upon finding the center and radius. The lesson includes the suggestion of giving homework using circle problems before this one to create background...
Curated OER
Polar Equations
In this precalculus instructional activity, students find the solutions to polar equations for the 3 detailed problems using the coordinates and graphing calculators.
Curated OER
Graphing Polar Equations
In this graphing polar equations worksheet, students solve and complete 10 various types of problems. First, they construct a table of values using the special angles and their multiples. Then, students plot the points in the table on a...
Curated OER
Graph Creator
Students rewrite equations using algebraic symbols. In this algebra activity, students graph linear equations using the slope and y intercept. They make predictions about their graphs and analyze the results.
Curated OER
Absolute Value Equations and Inequalities
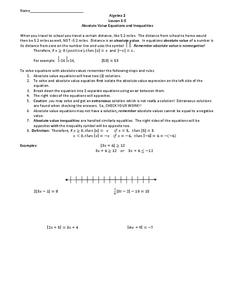
In this Algebra II worksheet, 11th graders solve and graph the solutions to absolute value equations and inequalities. The two page worksheet provides explanation and examples in addition to sixteen practice questions. Answers are not...
Curated OER
Solutions to Equations with Variables on Both Sides
Students solve equations with variables on both sides. In this algebra lesson, students solve equations using addition, subtraction, multiplication and division. They graph their solution on a coordinate plane.
Curated OER
Understanding Equations of Functions
Students write equations for different functions. In this algebra lesson, students observe data and find the function that goes along with that data. The identify the line of best fit.
Curated OER
Real Life Graphs
For this real life graphs worksheet, students examine graphs and determine the equation of a line. They interpret distance time graphs and draw graphs to match a real life situations. This three-page worksheet contains 3 multi-step...
Curated OER
Graphing Radical Functions-A Graphic Introduction
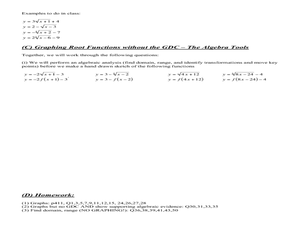
In this Algebra II worksheet, 11th graders graph root functions and analyze the domain, range, intercepts, maximum and minimum values, and end behavior. students use that information to transform the graphs of root functions. The three...
Curated OER
Constructing and Solving Linear Equations
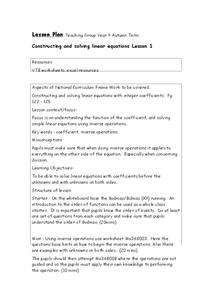
Students construct and solve linear equations. In this algebra lesson, students solve equations and graph lines using the slope. They identify the different parts of an equation including the leading coefficient.
Curated OER
Computer Graphing Calculator Explorations
Students explore the graphing calculator feature on the Macintosh computer to explore some "parent" functions and their translations, combinations, and composites.
Curated OER
Logarithmic Equations
In this logarithmic worksheet, students solve given logarithm equations. Two problems may be solved by graphing. This one-page worksheet contains ten problems.
Curated OER
Addition to Solve System of Linear Equations
In this algebra activity, students solve system systems of equation. They use addition to solve the problems. There are 6 questions with an answer key.
Curated OER
Visualiziing Equations
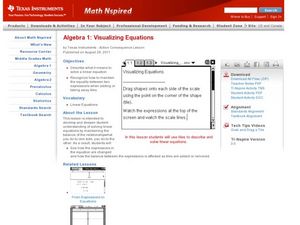
Young scholars use visuals and words to solve equations. In this algebra lesson, students observe the necessary steps needed to add, subtract,multiply and divide to solve an equation. They graph their solution using the TI calculator.
Curated OER
Equations, Expressions, Factorization
Students graph and solve equations and expressions. In this algebra lesson, students use simple factorization to simplify expressions. They review for an exam by doing basic algebra.
Curated OER
Graphing Square Root
In this algebra activity, students graph square root functions. They use translation to move the graph around. There are 4 questions with an answer key.
Curated OER
SETI WebQuest and the Drake Equation
Students complete a WebQuest where they research the Internet for extraterrestrial intelligence. In this extraterrestrial lesson plan, students also explore how the Drake Equation can predict the occurrence of life elsewhere.
Curated OER
Student Costs Graph
Students calculate the mileage, gasoline costs, and travel time and costs for a vacation. They conduct a virtual field trip, and create a comparison graph of costs using Microsoft Excel software.
Curated OER
Graphing Inequalities
In this inequality instructional activity, learners graph inequality equations on a coordinate plane. They shade in the coordinate plane to indicate the answer set. This two-page instructional activity contains five problems.
Curated OER
Topic 3.4: Graphing Systems of Inequalities
In this inequality worksheet, students graph systems of inequalities. Systems contain two to three equations. A coordinate plane for providing answers is located below each system. This two-page worksheet contains nine problems.
Curated OER
Inequalities and Their Graphs
In this algebra instructional activity, students identify the solution of an inequality. They graph their answers on a number line. There is an answer key to this problem.
Curated OER
Exploring Slope and Intercept
In this slope and intercept worksheet, students complete 23 problems involving sketching graphs, interpreting graphs, and interpreting slope.
Curated OER
Slopes of Lines
Learners examine a graph and relate it to the real world situation it depicts. They investigate changes in an equation and the appearance of a line. They investigate the connection between the graph of a situation and the meaning of the...
Curated OER
Parabolas
Students investigate parabolas and their equations. In this parabolas and their equations lesson, students graph quadratic equations on their graphing calculator. Students find the axis of symmetry of a parabola. Students discuss the...
Other popular searches
- Graphing Equations 4th Grade
- Graphing Equations of Lines
- Graphing Equations Project
- Intro to Graphing Equations
- Graphing Equations Puzzle
- Ged Graphing Equations
- Algebra Graphing Lines
- Graphing Lines Quilt Pattern
- Graphing Equations on a Grid
- Systems of Equations Graphing
- Linear Equations and Graphing
- Linear Equations Graphing


