Texas Education Agency
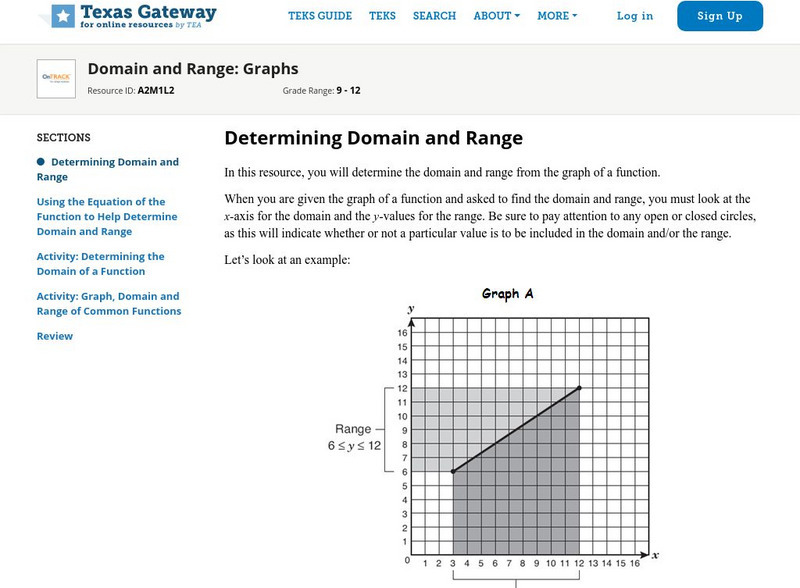
Texas Gateway: Domain and Range: Graphs
Given a function in graph form, identify the domain and range using set notation, interval notation, or a verbal description as appropriate.
TeachEngineering
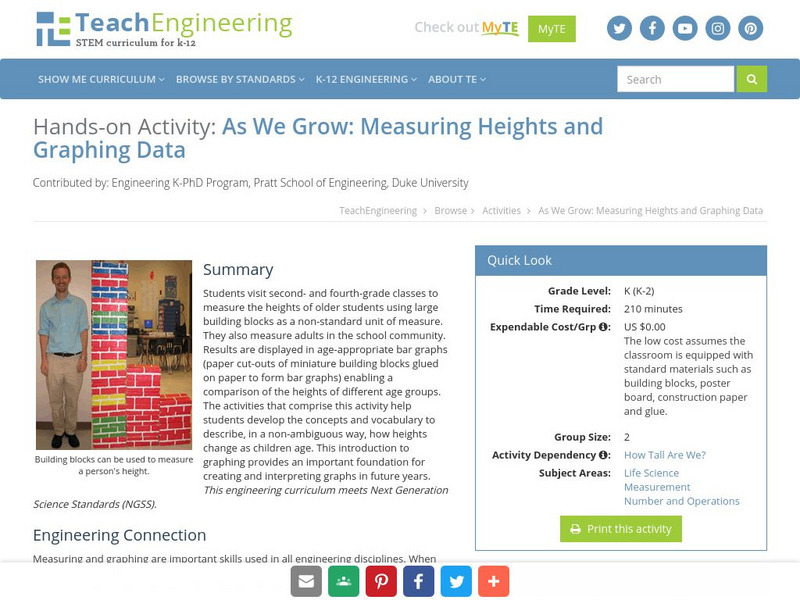
Teach Engineering: Growing and Graphing
Students visit a 2nd and a 4th grade class to measure the heights of older students using large building blocks as a non-standard unit of measure. They can also measure adults in the school community. Results are displayed in...
CK-12 Foundation
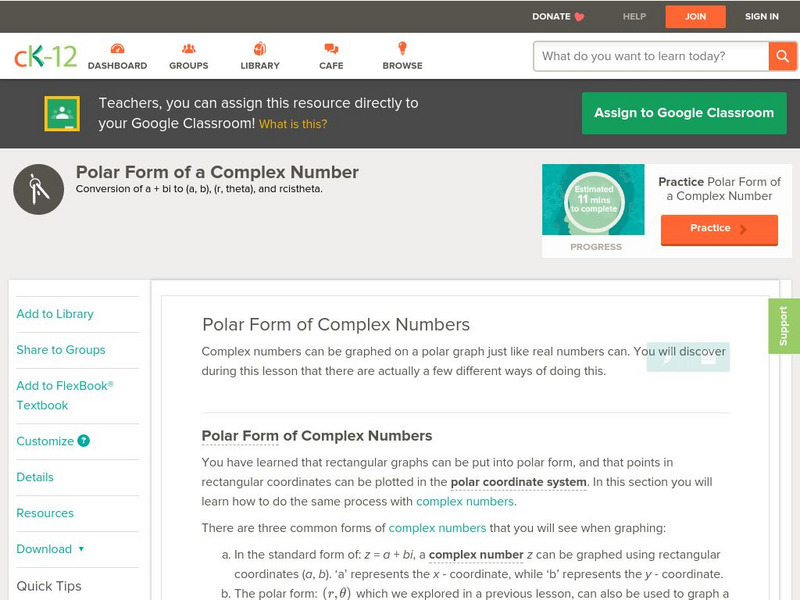
Ck 12: Polar Form of a Complex Number
[Free Registration/Login may be required to access all resource tools.] Here you will learn how to convert complex numbers from rectangular form to polar form. You will also explore the graphs of complex numbers on a polar graph.
Illustrative Mathematics
Illustrative Mathematics: F if.c.7.a, a sse.b.3, F if.c.7: Graphs of Quadratic
During this task, students will realize that equivalent expressions produce the same graph. The lesson plan will lead to discussions about the value of different forms of equations. Aligns with F-IF.C.7.a, A-SSE.B.3, and F-IF.C.7.
Concord Consortium
Concord Consortium: Quadratic Functions in Vertex Form
Given the equation of a quadratic function in vertex form, students learn to identify the vertex of a parabola from the equation, and then graph the parabola.
Interactive Mathematics
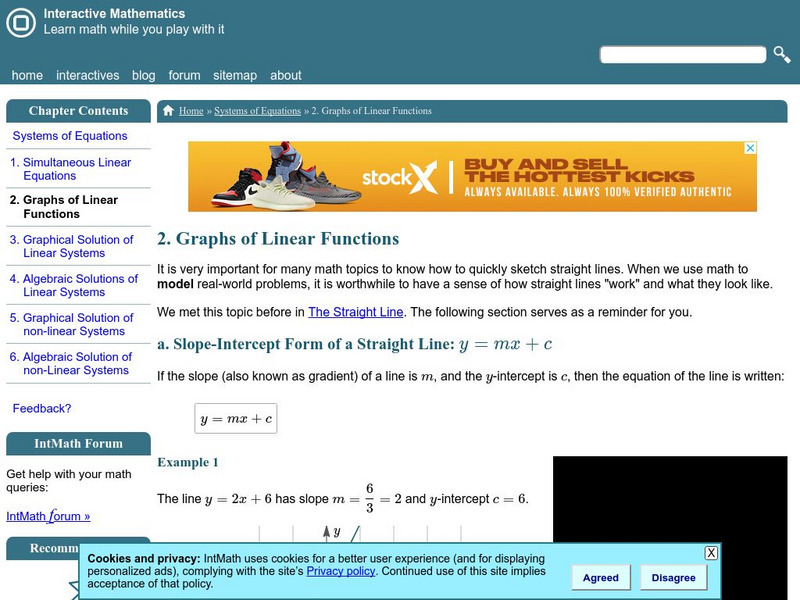
Interactive Mathematics: Graphs of Linear Functions
A brief overview of three methods used to graph lines is presented through examples. Slope-intercept, point-slope, and intercept form are demonstrated step-by-step along with a review of the formula for finding the slope of a line.
Washington State University
Washington State University: Graphing Linear Equations
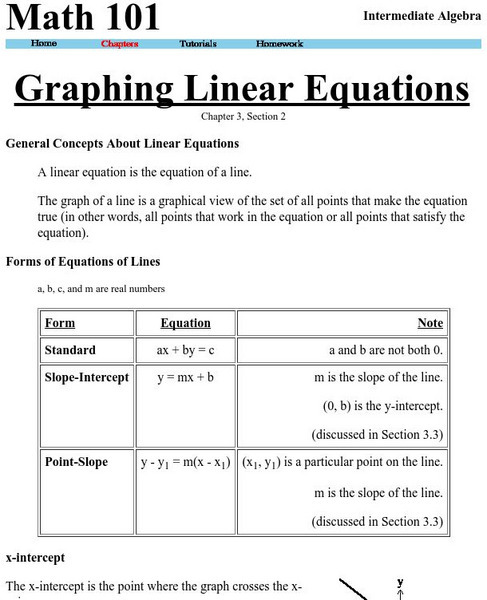
This site explains what a linear equation is, general forms of linear equations, how to graph a line using the method of plotting points. The site also details how to find points on the line given the equation, information about the...
Ducksters
Ducksters: Kids Math: Linear Equations: Slope Forms
Explore the slope-intercept and point-slope forms of linear equations and how to graph them on this webpage.
Paul Dawkins
Paul's Online Notes: Algebra: Ellipses
Detailed math tutorial features notes and examples that illustrate graphing ellipses using the standard form.
CK-12 Foundation
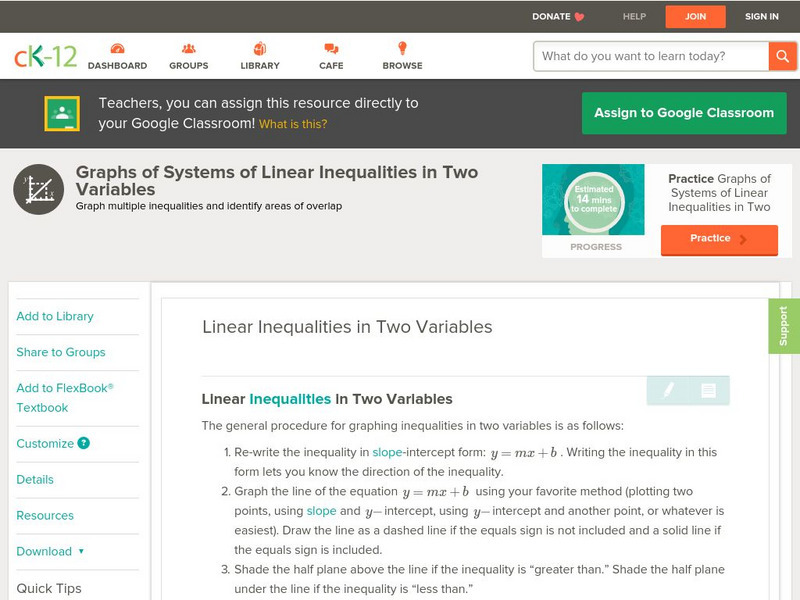
Ck 12: Algebra: Linear Inequalities in Two Variables
[Free Registration/Login may be required to access all resource tools.] Solve and graph linear inequalities in two variables on the coordinate plane.
Purple Math
Purplemath: Solving Linear Inequalities: Introduction and Formatting
This resource demonstrates how to solve linear inequalities step-by-step and shows four different solution formats/notations viz. inequality notation, set notation, interval notation, and the last "notation" which is more of an...
Concord Consortium
Concord Consortium: Linear Equations: Y=mx+b
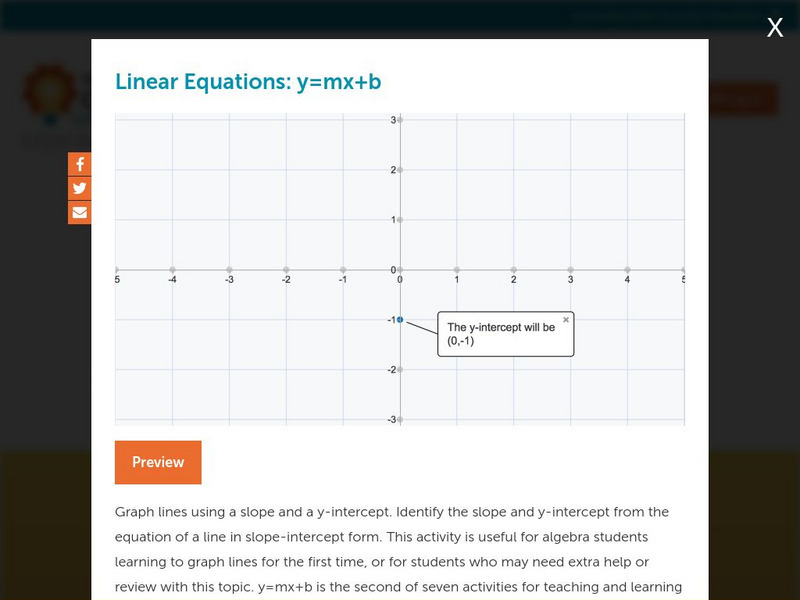
Graph lines using a slope and a y-intercept. Identify the slope and y-intercept from the equation of a line in slope-intercept form.
Concord Consortium
Concord Consortium: Linear Equations: Points, Intercepts, and Slopes, Oh My!
Learn how to graph lines with two methods: using x- and y-intercepts and using point-slope form.
Khan Academy
Khan Academy: Features of Quadratic Functions: Strategy
Identify the form of a quadratic function that immediately reveals a given feature of that function. Features in question are the y-intercept of the graph, the zeroes ('roots') of the function, and the vertex of the parabola.
Free Math Help
Free Math Help: Direct Variation
The discussion examines direct variation. Students learn about the math concept through definitions and sample exercises.
TeachEngineering
Teach Engineering: How Tall Are We?
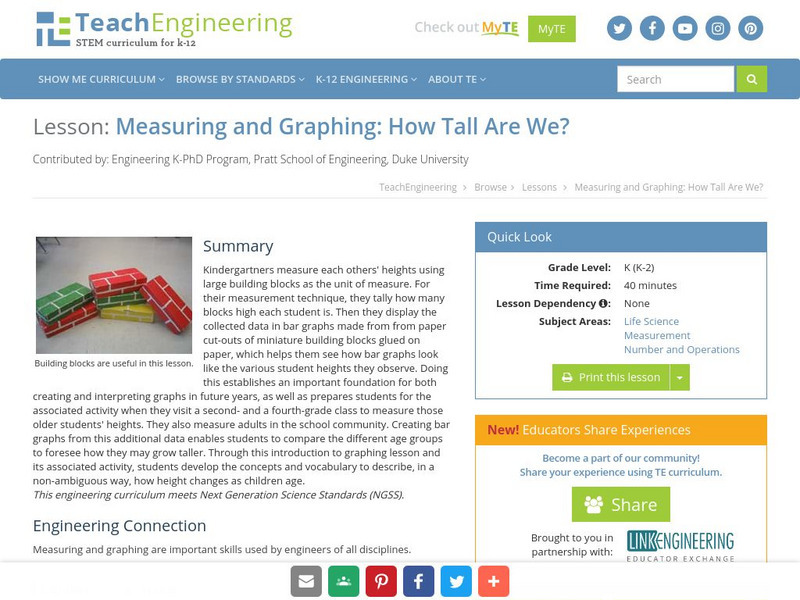
Kindergartners measure each other's height using large building blocks, then visit a 2nd and a 4th grade class to measure those students. They can also measure adults in the school community. Results are displayed in age-appropriate bar...
Illustrative Mathematics
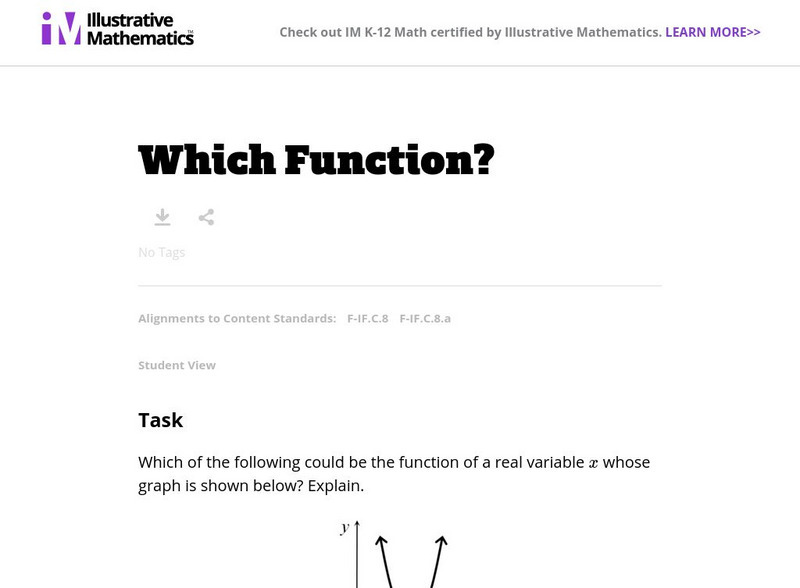
Illustrative Mathematics: F if Which Function?
For this task, students are presented with a graph and asked to identify the functions that could be represented by it and explain their thinking. The task addresses knowledge related to interpreting forms of functions derived by...
Council for Economic Education
Econ Ed Link: Phillips Curve
This lesson explores the relationship of unemployment to inflation in the 1960s and after. Students will discover the short-run trade-off between inflation and unemployment when unemployment is less than its natural rate. Students will...
Other
Helping With Math: Generating Patterns & Identifying Relationships
A tutorial and downloadable worksheets that practice generating patterns and identifying relationships. It offers a pretest, an explanation with examples, practice, and a test.
