CK-12 Foundation
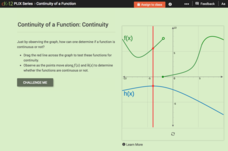
Continuity of a Function: Continuity
Does the point continually move along the graph? Pupils drag a line across two functions to determine whether they are continuous or not. They answer questions about the properties of continuous and discontinuous functions. Using their...
CK-12 Foundation
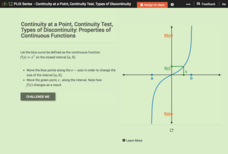
Continuity at a Point, Continuity Test, Types of Discontinuity: Properties of Continuous Functions
Take a closer look at continuous functions within given intervals. Using the parent cubic function, learners explore properties of continuous functions on intervals. Pupils interpret the Intermediate Value Theorem and the Extreme Value...
CK-12 Foundation
Inverse Functions: Definition of Inverse Functions
Is the inverse of a function also a function? Pupils manipulate the graph of a function to view its inverse to answer this question. Using a horizontal and vertical line, class members determine whether the initial function is...
CK-12 Foundation
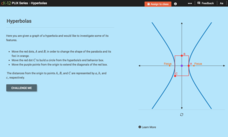
Hyperbolas
Hyperbolas—practice thinking outside of the box. Pupils alter the end behavior box to create various graphs of hyperbolas. They determine formulas to find the distance from the origin to the foci. Using that information, scholars...
CK-12 Foundation
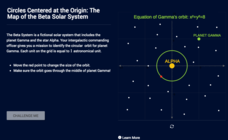
Circles Centered at the Origin: The Map of the Beta Solar System
Calculate galactic orbits in a far-out resource. Pupils drag a point on a circle to graph the orbit of a fictional planet. Using the equation, they find points through which the orbit passes. To finish the simulation, users determine the...
Curated OER
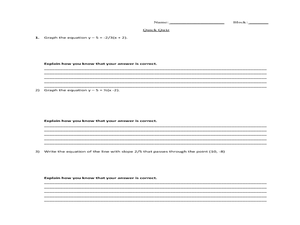
Slope, slope-Intercept Form and Standard Form
Students investigate and solve linear equations using slopes. In this algebra activity, students graph lines using the slope and y intercept. They also find the slope by rewriting their equation in to slope-intercept form from standard...
Curated OER
Linear Relationships - Standard Form
Students use a graphing calculator to examine the association between the data points and equation of a linear relationship. They write equations in standard form and then graph the equations using the slop-intercept form. Answer Key...
Curated OER
Systems of Linear Equations - Standard Form
Students write systems of equations and find solutions to systems of equations. They explain how they determined their solutions to a system of equations and justify their solutions. In addition, they write equations in standard form and...
Curated OER
Slopes, Slope-Intercept Form, Standard Form
Students identify the slope of an equation using various methods. In this algebra lesson, students graph linear equations and calculate the slopes using the x and y intercept to solve the equations and graph the lines. They use the slope...
Alabama Learning Exchange
How Clouds Form
Young scholars analyze how clouds form. In this cloud formation lesson, students brainstorm types of clouds and what they think they're made of. Young scholars conduct an experiment to see how clouds form and discuss their observations....
Curated OER
Graphing Linear Equations
In this calculator active graphing worksheet, students graph 12 equations via a calculator and transfer the graphs onto coordinate grids.
Curated OER
Solve Linear Systems of Equations: Graphing, Substitution, and Elimination
In this system of linear equations worksheet, students solve by using graphing, substitution, and elimination. There are 44 problems.
Curated OER
Standard Form of Equations
Learners complete the square and identify different parts of a quadratic equation. In this algebra lesson, pupils graph conics using the TI calculator. They rewrite equations by completing the square.
Curated OER
Graphing Linear Equations
Ninth graders review the information that they have already learned
with regard to linear equations and graphical representations. They then assist in combining equations with a graphical element and complete various graphs with this...
Curated OER
Bar Graphs
Students perform operations and graph their data using charts and bar graphs. In this algebra lesson plan, students follow specific steps to make a bar graph. They create a survey about people favorite things and plot their data...
Curated OER
Graphs
Young scholars explore graphs and define the different ways they are used to display data. In this algebra lesson, students collect data and plot their data using the correct graph. They draw conclusions from their graphs based on their...
Curated OER
Where Do I Fit on the Graph?
Students collect data and create graphs about themselves, their community, and the world around them. They use a variety of methods to organize data, such as stickers, clothespins, name tags, coloring, tally marks, etc.
Curated OER
Solving Systems by Graphing
Students solve systems of equation through graphing. In this algebra lesson, students solve linear equations and analyze the result to figure out if there is one solution, no solution or infinitely many solutions. They graph their lines...
Curated OER
Standard Form Equation of Ellipse
In this equation of an ellipse worksheet, learners find the missing numbers in 8 equations when given the drawing of the ellipse. Students graph 9 ellipses on a coordinate grid when given the equation. In the final activity, learners...
Curated OER
"Graphing Your Motion"
Students study the concepts of motion, velocity, and acceleration through graphing their own movement using LoggerPro. They explain the difference between speed and velocity using the weather vane example. They discover the difference...
Curated OER
Getting the Goods on Graphing
Students explore graphing. In this math lesson plan, students graph ordered pairs in the coordinate plane, write the coordinates of points shown on a plane, and create designs or pictures using ordered pairs.
Curated OER
Graphing Systems of Equations
In this graphing systems of equations worksheet, 9th graders solve and graph 8 different problems that include solving various systems of equations. First, they use the graphs show to determine whether each system has one solution, no...
Curated OER
Logarithmic Functions and Their Graphs
In this algebra worksheet, learners evaluate, graph and solve logarithmic functions. They rewrite log functions and identify different log properties.
Curated OER
Trigonometry Practice: Trigonometric Graphs #2
In this trigonometric functions worksheet, high schoolers solve 8 multiple choice and graphing problems. Students graph trigonometric functions given an equation and match graphs to a given scenario.
