Curated OER
Don't Slip!
Young scholars measure, record, and graph the force of moving a block of wood along sand paper. In this friction lesson plan, students read a spring scale, collect data, construct a graph, and propose a model to explain how fiction works.
Curated OER
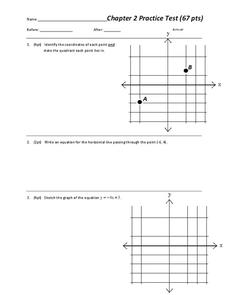
Chapter 2 Practice test
Overall, this worksheet contains a good selection of problems that reviews different aspects of linear equations. Learners examine and graph linear equations, absolute value equations, and inequalities in two variables. The three page...
Curated OER
Digital Statistics
Research data analysis by creating charts in class. Define the differences between an "average" and "range" while examining measurement data based on student height. Utilize computer software to create a height graph which is shared with...
Curated OER
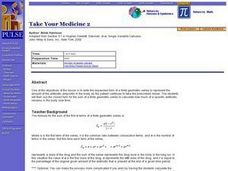
Take Your Medicine 2
Real-world application of the finite geometric series. Sick? Need to take Ampicillin? How much is in the body at any given point in time as this medication is taken over the course of time. Use the formulas, make calculation, and graph...
Curated OER
Our Pets
In this graphing worksheet, students survey their classmates about what pets they like. Students record the data in the form of a bar graph. There are 8 choices listed.
Texas Instruments
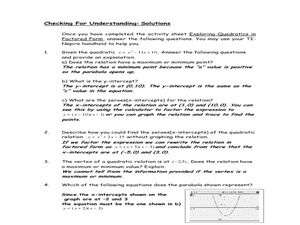
Exploring Quadratics in Factored Form
Young mathematicians explore quadratics equations in this lesson. They investigate the relationship between the standard form and factored form of quadratic equations. Learners then examine the relationship between the factoring form of...
Curated OER
Vertex and Factored Form of Quadratic Functions
Young scholars graph quadratic equations. In this algebra instructional activity, students solve quadratic equations by factoring. They identify the end behavior of the graph.
Curated OER
Human Activity and the Environment
Students review and analyze graphs and tables as a group. They develop their graph and data analysis skills by converting data tables from Human Activity and the Environment into graphs.
Curated OER
Graphing Linear Functions - Review
Young scholars graph linear functions. They plot three points, create a line, and discuss methods to find the slope of line. In groups, students solve problems, graph their lines and find the slope of a line using various methods. ...
Curated OER
Graphing Aquatic Insects
Students identify aquatic insects. In this organism instructional activity, students locate aquatic insects near a local waterway and collect them. Students graph the amount of insects that they collected.
Curated OER
Graphing Family Reading Habits
Second graders collect data from their families about their reading habits and graph them. In this graphing family reading habits instructional activity, 2nd graders interview family members about their reading habits. They then use a...
Curated OER
Modeling Linear Relationships
Students graph lines using the slope and y-intercept. In this algebra lesson, students create data using tables and equations. They use their data to make predictions and draw conclusion.
Virginia Department of Education
Transformationally Speaking
Young mathematicians explore transformations of graphs by graphing sets of functions on the same pair of axes. They use their graphs to determine the effect that the values of a and b in y = ax + b have on the graph of y = x.
Curated OER
Scattered About
Students are introduced to the concept of scatter plots after reviewing the various types of graphs. In groups, they analyze the type of information one can receive from a scatter plot and identify the relationship between the x and y...
Virginia Department of Education
Numbers in a Name
What's in a name? Pupils create a data set from the number of letters in the names of classmates. Each group then takes the data and creates a visual representation, such as a histogram, circle graph, stem-and-leaf plot, etc.
abcteach
What is Your Favorite Month?
A simple worksheet that helps learners conduct a survey is here for you. In it, pupils collect data on their family and classmate's favorite months. Youngsters use tally marks in the spaces provided to keep track of the answers. Once...
Curated OER
Relations and Graphs
Here is a simple, yet clever lesson on how to teach the important concepts of greater than, less than, and equal to. Pupils write their names down on grid paper - one letter per box. They compare their names and find a name that is...
Curated OER
Graphs of the Heart
Students study Greek literature. In this Greek tragedies lesson plan, students explore the dance-dramas of Martha Graham. Students study the choreography that brings ancient Greek literature to life.
Concord Consortium
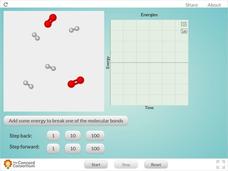
Reaction Between Hydrogen and Oxygen Molecules
When molecules of hydrogen and oxygen are combined, how does water form? Science scholars observe changes in kinetic and potential energy during a chemical reaction in an interactive. The resource features easy controls that allow users...
EngageNY
Forming a Research-Based Claim: Cascading Consequences Chart
Can you put that in writing? Scholars work with a partner to write a practice claim before writing their own claims. After writing their claims, learners share with class using a Concentric Circles activity.
EngageNY
Curves from Geometry
Escape to investigate hyperbolas. Pupils take a look at what happens to the elliptical orbital path of a satellite that exceeds escape velocity as the opener to the eighth lesson in a unit of 23. Scholars analyze basic hyperbolas and how...
CK-12 Foundation
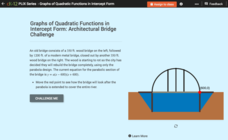
Graphs of Quadratic Functions in Intercept Form: Architectural Bridge Challenge
There are architectural parabolas all around us! A creative lesson analyzes the architecture of a parabolic bridge. Learners must manipulate the bridge to satisfy given criteria and then answer questions about the dimensions of the...
ProCon
Obesity
Is obesity a disease or just a preventable risk factor for other diseases? Scholars attempt to form their own opinions by reading a background of the issue and watching videos that explore the main pro and con arguments using an included...
CK-12 Foundation
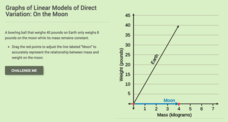
Graphs of Linear Model of Direct Variation: On the Moon
You'll be over the moon about this resource. Scholars draw a line representing the weight of an object on the moon based on its mass. Consideration of the constant of proportionality allows them to see relationships between weight of an...

