Curated OER
Systems of Linear Inequalities in Slope-Intercept Form -- Lecture
Learners are introduced to linear inequalities in slope-intercept form. As a class, they participate when needed in a demonstration given by their teacher and practice graphing inequalities and describing the solution. They set up and...
Curated OER
Graph Around the Room
Students discuss the importance of taking care of their bodies. They brainstorm ways to take care of their bodies. They create a graph.
Curated OER
Graphing Data - Temperature
Seventh graders measure and record temperature over a given time period. They compare the recorded temperatures to the 40-year recorded normal average temperatures for the same area. Students display and interpret their findings in a graph.
Curated OER
Virtual Field Trip / Route, Mileage and Gasoline Cost Graphs
Students use a spreadsheet program to graph and compare milage, gasoline costs and travel time for two travel routes in their virtual field trip in Michigan. They determine the most economical route based on the graphs and calculations.
Alabama Learning Exchange
Explore the Transformations of Linear and Absolute Value Functions Using Graphing Utilities
Students explore the concept of transformations. For this transformation instructional activity, students use an applet that is an interactive absolute value graph applet. Students manipulate the applet to examine the change...
Curated OER
Transforming Parabolas
In this Algebra II worksheet, 11th graders examine the affects of changing h and k in the vertex form of the parabola. The three page worksheet provides explanation of topic, worked examples, and four practice problems. ...
Curated OER
What Pie?
Students practice making and interpreting pie graphs so they are better able to decide if a pie chart is the appropriate form of display. Students examine included overheads of different pie charts, and directions on how to make pie...
Curated OER
Parabolas
In this parabolas worksheet, 10th graders solve and complete 15 different problems related to parabolas. First, they define parabola and its information related to graphing one. Then, students write each equation in standard form. They...
Curated OER
Writing in the Math Classroom
Young scholars determine the vertex, y-intercept and direction of a parabola and write an explanation of how to graph a parabola. They collect and graph data using a calculator.
Curated OER
Writing Linear Equations
In this math worksheet, students write the equations in slope intercept form for the equations that are graphed. They also create equations using slope and intercepts.
Curated OER
Data Handling
In this data handling worksheet, students explore multiple ways to represent data. They create stem and leaf plots, histograms, and bar charts. Students examine and interpret diagrams and statistics. This eleven-page...
Curated OER
Properties of Logarithms
Students explore the concept of logarithms. In this logarithms instructional activity, students graph logarithms on their Ti-Nspire calculator. Students describe the shapes of their graphs by identifying slope, y-intercepts,...
Curated OER
Conic Sections
In this conic sections learning exercise, learners solve and complete 8 different problems identifying various types of conic sections. First, they write each equation given in standard form. Then, students determine whether the graph of...
Curated OER
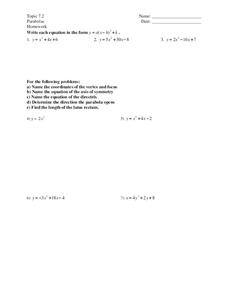
Parabolas 7-2
For this parabola worksheet, students define a parabola and all of its parts. They then solve 4 problems in which they change an equation into vertex form, identify the significant features, and graph it. Finally, students solve 3...
Curated OER
Chapter 2.3 - Slope
In this slope learning exercise, students answer 16 slope intercept questions. They determine slopes based on equations, graphs and coordinates. Students also find the equations of lines parallel and perpendicular to a given line and...
Curated OER
Parabolas
In this parabolas instructional activity, 11th graders solve and complete 7 different problems. First, they write each equation in the given form. Then, students name the coordinates of the vertex and focus. They also name the equation...
Curated OER
Data Analysis: bird habitats in rice farms
Fifth graders make a graph and write an essay to interpret the data of birds that take advantage of habitats near rice farms. In this data lesson plan, 5th graders calculate the information given to them and interpret it in an essay form.
Curated OER
Analyzing Country Data
Students analyze different data in percentage form. In this statistics lesson, students plot data using box-plots, dotplot, and histogram. They compare and contrast the collected data using the boxplot.
Curated OER
Slope of Line
In this algebra worksheet, students calculate the slope of a line. They graph a linear equation given the slope and y-intercept and identify the slope and y-intercept given a linear graph. There are 15 questions.
Curated OER
Bounce With Me
How many practice lay-ups do you think Michael Jordan has done in his lifetime? Too many to count, but he had to start somewhere! Practice is the key to getting better in any activity. Look through this basketball lesson as there are...
Curated OER
Rational Functions
Through a mini assessment, students identify and list the vertical and horizontal asymptotes for the given rational functions and determine the type of asymptote of a given rational function. They also decide which form of a function...
Curated OER
Geometry: Translations and Reflections
Group work and participation is used to perform a specified translation or reflection. In this geometrical translation lesson plan, small groups of pupils are each given a shape to plot on a coordinate grid. Each shape is then translated...
Curated OER
How Many?
Middle schoolers explore and design ways to collect data through simulations and random samples. They perform two experiments to determine the answers to various probability problems, and present the data/graphs in the form of a...
Curated OER
Write the equation of a line, given slope and a point
Young mathematicians write equations of lines in this algebra lesson. They solve linear equations into the slope intercept form. Next, they graph the lines using the slope and the y-intercept, and they write equations for the lines using...


