Cuemath
Cuemath: Frequency Distribution Table
A comprehensive guide for learning all about frequency distribution tables with definitions, how to create a frequency distribution table, and the formulas and graphs related to frequency distributions. With solved examples and...
Khan Academy
Khan Academy: Evaluate Composite Functions: Graphs & Tables
Given the graphs, or some tables of values, of two functions, evaluate the composition of those functions at a given input.
Better Lesson
Better Lesson: Graphing Using a Frequency Table
Multiple graphs can represent the same data set and make the information easier to understand.
Other
Kindergarten lessons.com: Graphing Activities
Graphing activities for preschool and kindergarten include collecting data and organizing it in a variety of ways. There are lots of fun things to do in this area of math and the activities integrate well with science and literacy...
Scholastic
Scholastic: Cultivating Data
Students will understand key concepts of data analysis and their graphic representations. Students will construct and interpret data tables, line plots, box-and-whisker plots and stem-and-leaf plots, scatterplots with line of best fit,...
Other
Conflict Casualties Monitor: Iraq Body Count
This site calculates the current number of civilian deaths in Iraq due to the war and suicide bombings. In addition, it provides a number of graphs, tables, and articles that illustrate the terrible cost of war as well as a detailed...
PBS
Wnet: Thirteen: Math in Basketball: Lesson Plan
In this lesson plan, students will explore ways that mathematics are used in basketball. Students will explore the concept of a function and will learn to use function notation. Students will recognize, describe, and represent quadratic...
Alabama Learning Exchange
Alex: Ice Cream Sundae Survey
Students quickly realize the importance of learning how to read and find information in charts, graphs, and tables compared to finding the same information written in a paragraph. This is a fun, high energy instructional activity!This...
Idaho State University
Idaho State University: Flow Nets [Pdf]
Studying groundwater? Investigate this water table and graphs featuring flow nets and groundwater flow provided by ISU.
Alabama Learning Exchange
Alex: Heads Up!
The lesson is a hands-on project. Learners will work in pairs to gather various measurements, organizing the data into a provided chart. The measurements will be used to review, reinforce, and introduce skills such as measures of central...
Illustrative Mathematics
Illustrative Mathematics: F If.6 Mathemafish Population
For this task, students are presented with a table and a graph and are asked to summarize the data and report the findings of a project by the Environmental Protection Agency to contain the effects of an invasive species on a fish...
University of North Carolina
University of North Carolina: The Writing Center: Scientific Reports
A handout exploring how to complete a scientific report based on scientific research. The site describes the sections needed as well as how to insert graphs and tables.
EL Education
El Education: Sapling Rise a Micro Field Guide
Students create a field guide for a three foot by three foot plot of ground. Students name their plots, graph temperature, create an inventory and table to record observations, make illustrations, and write informational text based on...
EL Education
El Education: A Field Guide to East Bog Swamp
This micro-field guide was created by 5th and 6th graders in Marlboro, Vermont. Groups of 3 or 4 students worked together to investigate their own 3 by 3 foot research plot, over multiple visits, and then created a field guide to their...
Trinity University
Trinity University: Social Inequality
This is a site that explores social inequality. Includes tables and graphs to allow visual representations of the distribution of income and wealth. Also includes links to other sites.
US Environmental Protection Agency
Epa: Potential Changes in Emissions Due to Improvements in Travel Efficiency
An 84-page report from 2011 that addresses the issue of whether changes can be made in transportation to increase travel efficiency and reduce greenhouse gas emissions that contribute to climate change. Includes many tables and graphs...
US Energy Information Administration
Energy Information Association: u.s. Household Electricity Report
The report provides an overview of the electricity consumption in households in 2001. End-use (lighting, appliances, heating) data is presented in written, graph and table form. Background on efficiency standards and regional factors...
Texas Education Agency
Texas Gateway: Appendices: The Use of Mathematics in Principles of Economics
This appendix should be consulted after first reading "Welcome to Economics." Though economics is not math, there is no important concept in this course that cannot be explained without mathematics. That said, math is a tool that can be...
Missouri State University
Missouri State U.: Introductory Statistics: Concepts, Models, and Applications
This is a comprehensive online text about statistics which covers all the basic concepts.
Illustrative Mathematics
Illustrative Mathematics: 6 Sp.2,5d Electoral College
In addition to providing a task that relates to other disciplines (history, civics, current events, etc.), this task is intended to demonstrate that a graph can summarize a distribution as well as provide useful information about...
Science Buddies
Science Buddies: Data Analysis for Advanced Science Projects
The importance of data analysis in science projects is explained. Describes common mistakes young scientists make. The article then discusses how to find out what the standard methods of data analysis are for the type of research you...
Simon Fraser University
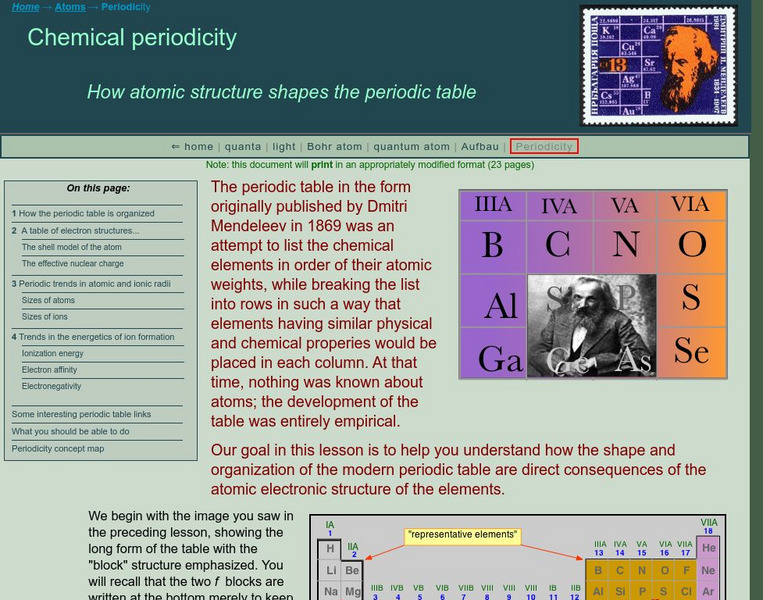
Chem1 Virtual Textbook: Periodic Trends in Ion Formation
Acting as a subtopic of the General Chemistry Virtual Textbook's section on Atoms and the Periodic Table, this site discusses electron affinity and ionization energy in relation to ion formation. Charts and graphs are included as well.
Illustrative Mathematics
Illustrative Mathematics: F if a Sse Modeling London's Population
In this task, students are shown a table of population data for the city of London and are asked to explore whether a linear, quadratic, or exponential function would be appropriate to model relationships within the data. They are next...
Illustrative Mathematics
Illustrative Mathematics: 8.ee Kimi and Jordan
This task looks at the job earnings plus weekly allowances of two people, all of which is saved. Students are asked complete tables showing their savings, write equations, draw their graphs, and compare the amounts they save each week....


