National Council of Teachers of Mathematics
The Math Forum: Graphing Linear Functions
Use this guide to practice graphing linear functions using Claris Works with your students. The lesson walks you through the process of setting up Claris Works step-by-step.
Khan Academy
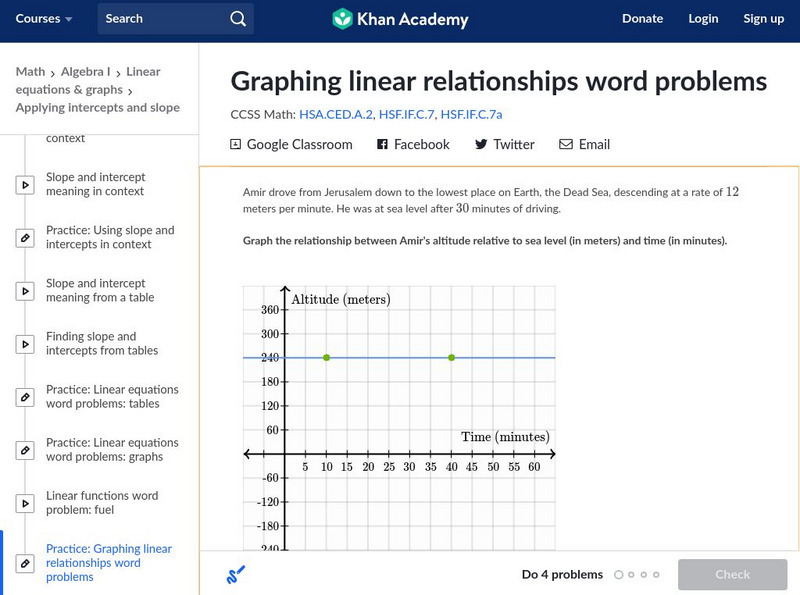
Khan Academy: Graphing Linear Functions Word Problems
Graph the line that represents a real-world relationship that is given verbally. Students receive immediate feedback and have the opportunity to try questions repeatedly, watch a video, or receive hints.
Illustrative Mathematics
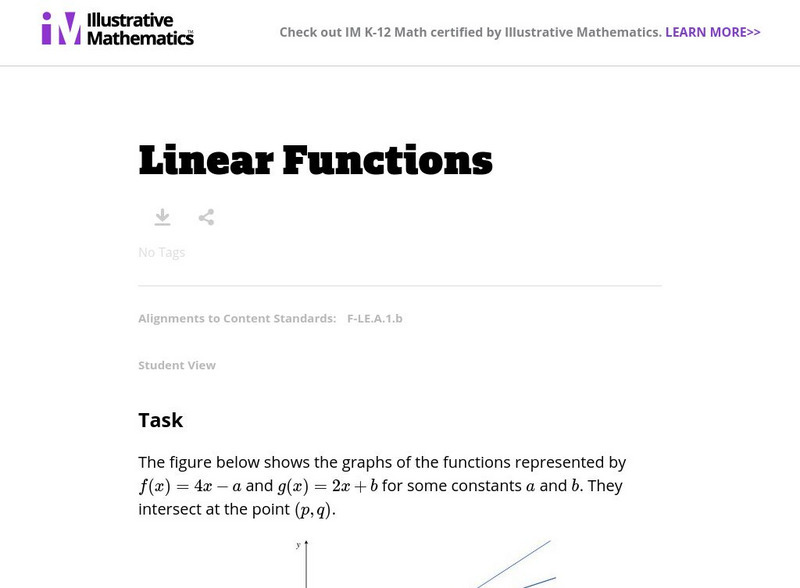
Illustrative Mathematics: F Le Linear Functions
In this problem, students are presented with the equations of two linear functions and their intersecting graphs. They are asked to label the graphs and compute values for several points on the graphs. Aligns with F-LE.A.1.b.
University of Georgia
University of Georgia: Linear Functions
Contains a brief summary and a few examples of linear functions.
Math Planet
Math Planet: The Slope of a Linear Function
Gain an understanding of how to find the slope of a linear function by viewing an example and a video lesson. [1:44]
Shodor Education Foundation
Shodor Interactivate: Lesson: Graphs and Functions
This lesson plan is directed at introducing young scholars to how to graph functions on the Cartesian coordinate plane. They will experience several categories of functions including lines and parabolas. Resources and interactive tools...
Common Core Sheets
Common Core Sheets: Functions 8.f.3 Worksheets
Print or create worksheets to assess students' understanding of linear functions.
Texas Education Agency
Texas Gateway: Writing Verbal Descriptions of Functional Relationships
Given a problem situation containing a functional relationship, the student will verbally describe the functional relationship that exists.
Other
Graph pad.com: Comparing Linear Regression to Nonlinear Regression
This resource presents a complete and detailed look at linear regression. This guide provides lots of details and graphs to explain each concept.
CK-12 Foundation
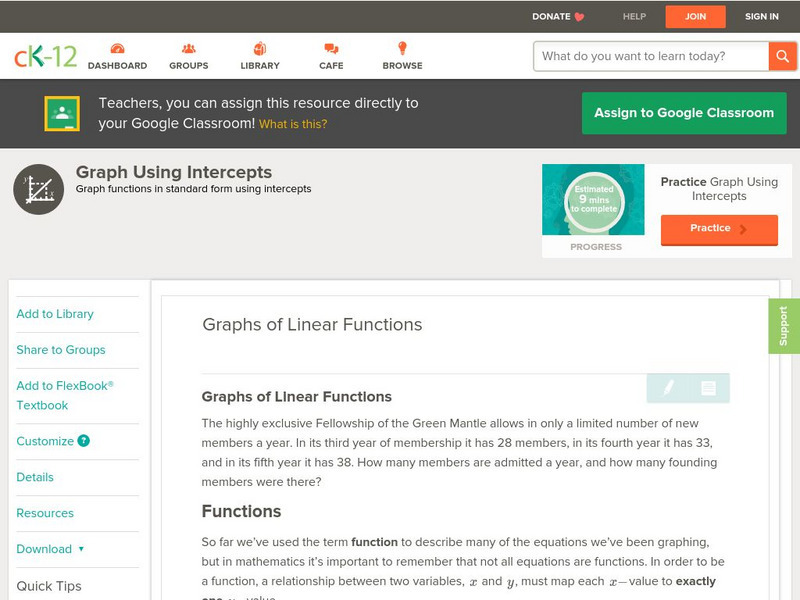
Ck 12: Algebra: Graph Using Intercepts: Graphs of Linear Functions
[Free Registration/Login may be required to access all resource tools.] In this tutorial, students learn to write and evaluate functions and determine if a graph represents a function. They examine guided notes, review guided practice,...
Illustrative Mathematics
Illustrative Mathematics: F Le What Functions Do Two Graph Points Determine?
In this task, students find a unique linear function, a unique exponential function, and more than one quadratic function that go through the same two points on the coordinate grid. Aligns with F-LE.A.
Student Achievement Partners
Illustrative Mathematics: Delivering the Mail [Pdf]
Assess students learning of linear functions with a summative assessment.
Texas Education Agency
Texas Gateway: Collecting Data and Making Predictions
Given an experimental situation, the student will write linear functions that provide a reasonable fit to data to estimate the solutions and make predictions.
Shodor Education Foundation
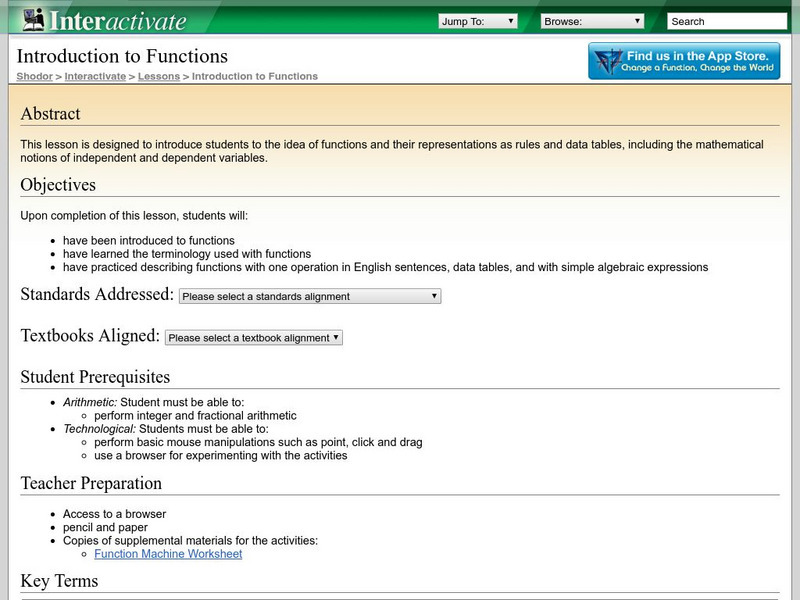
Shodor Interactivate: Lesson: Introduction to Functions
Input numbers into the function machine and explore independent and dependent variables.
Purple Math
Purplemath: Graphing General Polynomials, Radicals, Rationals, and Piecewise Fun
This resource provides an overview of graphing, giving examples of general polynomial, radical, rational, and piecewise functions. Also includes advice on common mistakes made by students.
Math Planet
Math Planet: Algebra 1: Exponential Growth Functions
An exponential function is a nonlinear function that has the form of y=a*b^x, where a != 0, b > 0. An exponential function with a > 0 and b > 1, like the one above, represents an exponential growth and the graph of an...
Shodor Education Foundation
Shodor Interactivate: Linear Inequalities
Students create linear inequalities and systems of linear inequalities on a coordinate plane. This is like a graphing calculator with advanced viewing options.
Illustrative Mathematics
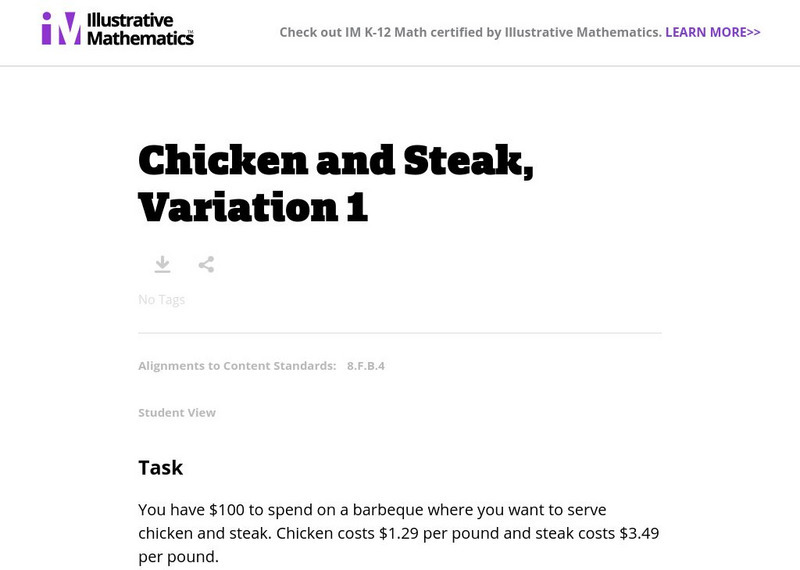
Illustrative Mathematics: 8.f Chicken and Steak, Variation 1
This task has students find a linear function that will calculate the amount of chicken and steak to purchase in order to stay within a given budget. Students then graph the function and interpret it. Aligns with 8.F.B.4.
Illustrative Mathematics
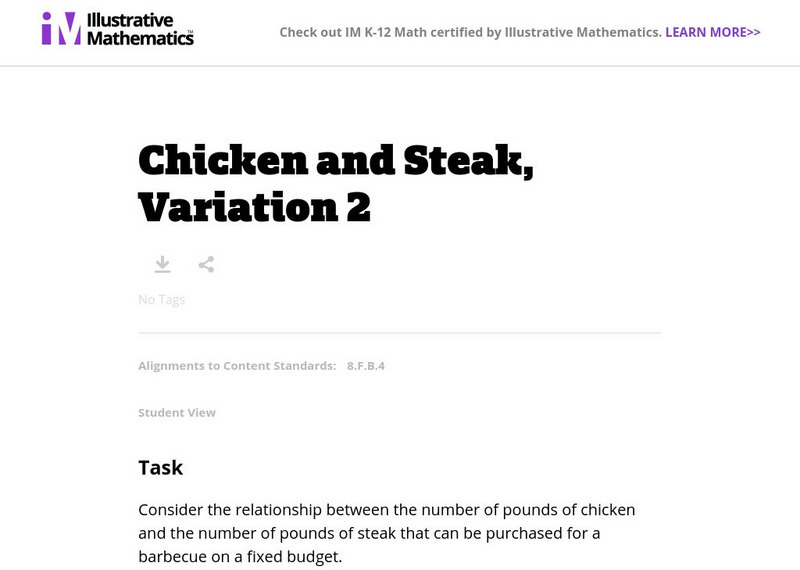
Illustrative Mathematics: 8.f Chicken and Steak, Variation 2
This task has students write an equation to calculate the amount of chicken and steak that can be purchased while staying within a given budget. Students then graph the function and analyze it, discussing the dependent relationship...
Illustrative Mathematics
Illustrative Mathematics: F Bf.3 Transforming the Graph of a Function
This task examines, in a graphical setting, the impact of adding a scalar, multiplying by a scalar, and making a linear substitution of variables on the graph of a function f. There is no formula for the function so the focus is on...
Illustrative Mathematics
Illustrative Mathematics: F Bf Building a Quadratic Function From F(x) = X^2
This is the first of a series of tasks aiming at understanding the quadratic formula in a geometric way in terms of the graph of a quadratic function. Here the student works with an explicit function and studies the impact of additive...
Illustrative Mathematics
Illustrative Mathematics: F Le, a Rei Population and Food Supply
In this task, learners analyze the sizes of a country's population and of its food supply to determine when and if food shortages will occur. To solve it, they must construct and compare linear and exponential functions and find where...
Khan Academy
Khan Academy: Lsn 13: Systems of Equations, Algebraic and Graphical Representations
Lesson 3 of 4 for Passport to Advanced Math. Students will solve systems of equations in two variables in which one equation is linear and the other equation is quadratic or another nonlinear equation; relate properties of the function f...
Illustrative Mathematics
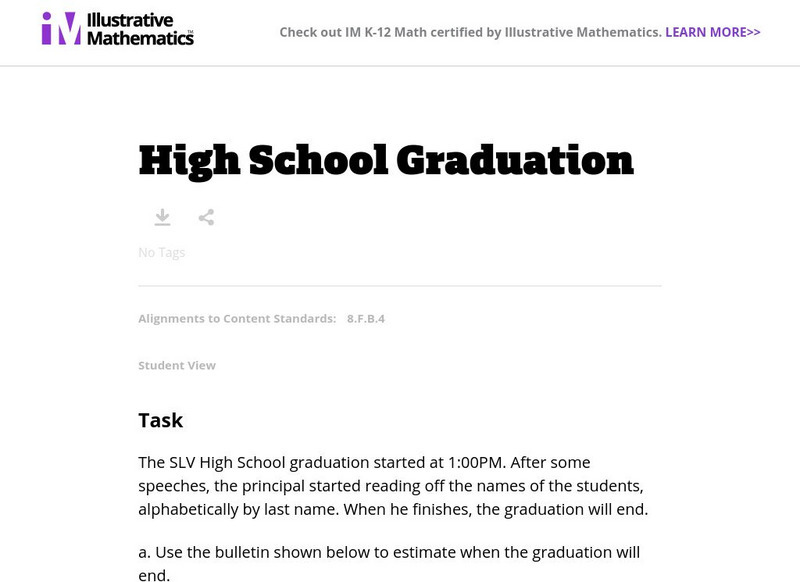
Illustrative Mathematics: 8.f High School Graduation
This is an interesting problem that presents a list of high school students who are graduating. Given the information on the pamphlet, 8th graders are asked to determine how long the speeches were and an equation that will help parents...




![Illustrative Mathematics: Delivering the Mail [Pdf] Unknown Type Illustrative Mathematics: Delivering the Mail [Pdf] Unknown Type](https://d15y2dacu3jp90.cloudfront.net/images/attachment_defaults/resource/large/FPO-knovation.png)

