Curated OER
Jellybean Graphs
Second graders predict and graph data based on the color of jelly beans they think are in a handful. In this prediction lesson plan, 2nd graders will predict how many of each color jellybean are in a handful. Then they graph these...
Curated OER
Statistical Pictures of School and Life
Pupils explore how mathematical data is used to summarize and illustrate everyday life. They apply mathematical concepts and skills to analyze data. Students conduct a five question survey of 50 people or more and graph the data.
Curated OER
Match The Graph Circles
High Schoolers engage in a study of circles and graphs that are related with the focus upon finding the center and radius. The lesson includes the suggestion of giving homework using circle problems before this one to create background...
Curated OER
Recognizing Bias in Graphs
In this bias in graphs worksheet, students examine graphs and explain the data. They determine why the graph is or is not biased. This four-page worksheet contains approximately 6 problems. Explanations and examples are provided.
Curated OER
Tulip Graphing
Students create a graph of tulip growth. In this data analysis instructional activity, students plant tulip bulbs and use graph paper to begin graphing data on the growth of the tulip.
Curated OER
Smarties Pictogram and Bar Chart
For this math worksheet, students create a bar chart to illustrate the number of Smarties they have in each color. Students also draw a pictogram to represent the same information.
Curated OER
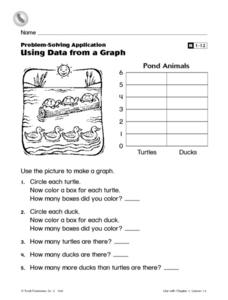
Using Data From a Graph
In this graphing worksheet, students create a bar graph with information from a picture of some pond animals. Students answer 5 questions about the graph.
Curated OER
Graphing Regions: Lesson 2
Students identify and analyze geographical locations of inventors. They each identify where their inventor is from on a U.S. map, discuss geographic patterns, and create a t-chart and graph using the Graph Club 2.0 Software.
Curated OER
Grand Grocery Graphs
Students experience creating their own graphs on graph paper and the computer program "Graph Club." They approach this task by utilizing food as their primary source for the activities. In addition, they interact with their peers as they...
Curated OER
Student Costs Graph
Young scholars calculate the mileage, gasoline costs, and travel time and costs for a vacation. They conduct a virtual field trip, and create a comparison graph of costs using Microsoft Excel software.
Curated OER
Graphing Nonlinear Equations
Young scholars graph non-linear equations. In this algebra lesson, students investigate different polynomial functions and their shapes. They identify the different powers and zeros.
Curated OER
Graphing Inequalities and Shading
Students graph and shade inequalities. In this algebra lesson, students graph inequalities using the slope-intercept form. They shade the side of the line that is the solution and identify the domain and range.
Curated OER
Coin Tossing and Graphing
Fifth graders use technology as assistance to collecting random data. Through the random data they will be able to explain the significance of getting a head or tail depending on what was previously landed on. They will then analyze the...
Curated OER
Sort and Graph Coins
In this sorting and graphing practice learning exercise, students cut out the coin pictures, glue 1 in each of 4 columns, and color in the graph with the correct number of each of the coins shown.
Curated OER
Graphing Ordered Pairs
In this graphing instructional activity, students graph ordered pairs on a coordinate plane. They connect each plot to create a picture. This one-page instructional activity contains 28 problems.
Curated OER
Pictures for Short Roleplays in Random Business Situations
In this role plays worksheet, students look at pictures of people and answer the short answer questions below them. Students explain 9 pictures.
Curated OER
Analyze This
Students gain practice in the analysis of various types of graphs common in daily life. These examples often use graphic images like charts, graphs, tables, and pictures to supplement learning.
Curated OER
Veggie Chop and Data Analysis
First graders chop vegetables into fractions. In this fractions lesson, 1st graders cut vegetables, collect data about favorite vegetables and create a bar graph using the information. Students make inferences about the data and record...
Curated OER
Creating Circles
Students make a circle graph. In this graphing lesson, the teacher conducts a class survey, then demonstrates how to make a pie graph. When students are comfortable with the material, they use a worksheet to create their own graph.
Curated OER
Gummy Bear Math
First graders predict, collect data, and create a graph based on gummy bear colors they are given. In this graphing lesson plan, 1st graders first predict how many colors of gummy bears there are. They then count the colors, graph them,...
Curated OER
M & M Madness
Students work with the mathematics unit of collection, organization, and presentation of data. In this math and technology lesson plan, students use Valentine M & M’s and The Graph Club to sort and graph the various colored M & M’s.
Curated OER
Numbers and Me
Learners collect and graph data about themselves. In this collecting and graphing data lesson, students poll their classmates about how many siblings they have or they measure their height. Learners make a bar graph of their data. ...
Curated OER
THE EASTER BUNNY GETS READY! PICTURE GRAPH
In this graphing worksheet, students read a picture graph about colors of Easter eggs and then answer questions about the graph.
Curated OER
Geometry Exam
In this reflections and symmetry worksheet, students draw lines of symmetry in shapes and patterns and reflect letters over lines in graphs. Students complete 20 problems.
Other popular searches
- Coordinate Graphing Pictures
- Cartesian Graphing Pictures
- Christmas Graphing Pictures
- Coordinates Graphing Picture
- Picture Graphing
- Graphing Picture With Ti 83
- Graphing Picture Fall
- Coordinate Picture Graphing
- Graphing Picture Squares
- Graphing Picture Autumn
- Picture Graphing Puzzles
- Graphing Picture Worksheets


