Curated OER
The Racing Heart
Fifth graders locate their own pulse rate from their carotid or radial artery, and graph their pulse rates after completing various exercise activities. They graph their data on a pie graph using Microsoft Excel software.
Curated OER
Water: From Neglect to Respect
The goal of this collection of lessons is to make middle schoolers more aware of the ways in which they are dependent upon water to maintain their standard of living. Learners compare water use in Lesotho to water use in the United...
Curated OER
Count The Letters
Young scholars perform activities involving ratios, proportions and percents. Given a newspaper article, groups of students count the number of letters in a given area. They use calculators and data collected to construct a pie chart...
Curated OER
Recycling Statistics
In this environment worksheet, students look for the answers to the environmental impact of recycling in Great Britain with the statistics from the pie graph.
Curated OER
Thinking About Technology: What Is It? How Can It Help Us?
What is technology and how can it help us? Using a worksheet, students read a list and choose practical applications of scientific knowledge, brainstorm examples of home, school and hospital technology, graph answers in a pie chart, and...
Curated OER
Television
Students investigate the invention of television and examine its role in their lives. They read and discuss an informational handout, list the pros and cons of television on a worksheet, and create a class pie graph illustrating the...
Curated OER
Show Me!
Students analyze and interpret graphs. In this graphing lesson, students view a video and construct their own graphs (line, circle, bar) from given sets of data.
Curated OER
Bar and Histograms (What Would You Use: Part 1)
Students practice creating bar graphs using a given set of data. Using the same data, they create a group frequency chart and histograms. They must decide the best graph for the given set of data. They share their graphs with the...
Bowland
Mystery Tours – Plan Your Tour
Everyone loves a vacation and a set of three activities has groups planning a tour of the U.K. using given distance, time, and price data. They solve a variety of problems related to the trip and produce a report on the success of...
Curated OER
Graph Both Crusts
Fourth graders calculate the angles and construct a pie graph of the percentages of the elements in the continental and oceanic crusts. Then they analyze the results. They can be assigned the task of researching the percentages.
Curated OER
Data Analysis
Pupils double check their data collections of Top 20 singles that they've been collecting for several days. Types of data is reviewed in detail and a variety of questions are asked for retention factors of mastery. They draw a tally...
Curated OER
Where in the World Is All the Water?
Students investigate the distribution of the earth's water. They conduct a demonstration of water distribution, and create a pie graph to display the results.
Curated OER
Meatiest States: Graph Problem Solving
In this graph problem solving learning exercise, students analyze a graph that shows commercial red meat production in five states. Students answer 5 word problems using the data on the graph.
Curated OER
Ratios Through Social Studies
Pupils analyze and integrate mathematical concepts within the context of social studies. They gather, present and analyze information on a bar graph, pie chart, etc. Students compute ratios. They demonstrate that ratios have real-world...
Curated OER
Musher Graphing and Probability
Students use the internet to research statistical information on the musher dogs participating in the Iditarod. Using the data, they create three different types of pie charts. They use the charts to answer questions about the dogs. They...
Curated OER
Mathematics Module
Delve into graphing! The concepts covered begin with basic graphing basic coordinates and algebraic expressions on coordinate planes, and build up to graphing linear inequalities and equations. Learners solve and simplify various...
Open Text Book Store
Arithmetic for College Students: Worksheets
Loaded with concepts ranging from multiplying decimals to converting units to solving problems using the order of operations, a thorough practice packet is perfect for a fifth or sixth grade math classroom.
Curated OER
The Muckrakers Interdisciplinary Unit
Eighth graders complete an Interdisciplinary Unit on the Muckrakers and the Progressive Movement. Students describe life in America and how Progressive Reformers changed it. identify specific problems and propose solutions. Students...
Curated OER
Changing Fractions: Worksheet 1
In this math learning exercise, students first write the fraction of the shaded area on the circles. Students then draw lines connecting markers on the perimeter of the circle and write the fraction using the new fraction that is shown.
Curated OER
M&Ms Count and Crunch
Middle schoolers practice skills involving statistics and probability by making predictions on number of each color candy in one pound bag of M&Ms. They record both guesses and actual quantities, calculate percentages, and create bar...
Sharp School
Geography Project
This very simple geography project can lead to a lot of useful referential information that can be displayed in your classroom! Learners construct a poster-size map of a country, identifying major demographic points and including pie/bar...
Curated OER
Doing The School Run
Students explore finding the percent of a numbers. They survey their peers to determine modes of transportation used in getting to school. Afterward, students organize information and create graphs and charts. They explore alternative...
Curated OER
Using Non-Text Features
Second graders examine graphs and charts from their local newspaper. As a class, they discuss what the data means and how it relates to the article. In groups, they are shown two sets of graphs or charts and they practice explaining...
Curated OER
All in the Circles
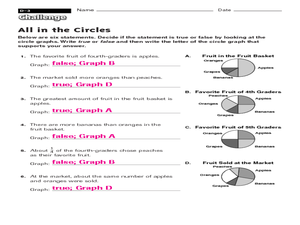
In this circles worksheet, students use 4 circle/pie chart graphs to answer a set of 6 questions. Answers are included on page 2.


