Curated OER
Every Graph Tells A Story
Seventh graders explore linear equations. In this graphing lesson, 7th graders explore constant rates of change. Students discover the real-life application of graphs and demonstrate their ability to read graphs and write corresponding...
Curated OER
Equations: Graphs, Lines, Slope
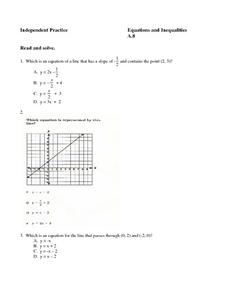
In this equations activity, students complete 8 multiple choice questions regarding writing equations in slope-intercept and matching an equation to its graph in the coordinate plane.
Curated OER
Charts and Graphs
For this charts and graphs worksheet, students refer to charts and graphs to solve word problems. Students complete 10 multiple choice word problems.
Curated OER
Number lines and graphs
In this number lines and graphs worksheet, students identify points on a number line and in a graph. Students complete 10 multiple choice questions.
Curated OER
Graphing systems of inequalities
In this graphing worksheet, students graph ten systems of inequalities. Students are then asked to find the area of the regions. A challenge problem is included. where students are asked to find the volume of the resulting solid.
Curated OER
Deciding Which Type of Graph is Appropriate
For this graphing worksheet, learners read about line, bar, and pie graphs and then determine which graph is the best way to express data results. This worksheet has 3 short answer questions.
Curated OER
Study Buddies - Bar Graphs
In this data collection worksheet, young scholars work with a partner to make 3 small bar graphs after finding the proper number of circles on the first page. They look at a page of a variety of shapes and separate the circles into...
Curated OER
Line and Double Line Graphs: Practice
In this graphing data worksheet, students use the double line graph to answer the five questions about high and low temperatures. Students then complete two test prep questions.
Curated OER
Exercises in Plotting Points
In this geometry worksheet, students practice plotting points on coordinate grids. They plot and translate points in 6 grids.
Curated OER
Graph Your Motion
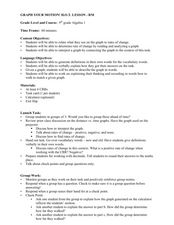
Pupils graph their linear equations. In this algebra lesson, students examine their lines and relate it to the slope or rate of change. They relate the steepness of the line to the slope being positive, negative or zero.
Curated OER
Histograms and Bar Graphs
Middle schoolers are introduced to histograms, bar graphs, and the concept of class interval. They use an activity and three discussions with supplemental exercises to help students explore how data can be graphically represented (and...
Curated OER
Graph Functions with Integers
Fifth graders can do a quick review of graphing functions using integers with this activity. The activity has questions which require students to identify the pertinent information in a word problem, and create a graph to represent the...
Curated OER
Free Fall Graphing Exercise
Twelfth graders practice their graphing skills in an exercise about acceleration due to gravity. Lesson opens with a demonstration of acceleration due to gravity and a brief discussion. Students complete a worksheet and go over answers...
Curated OER
Problem-Solving Application: Use a Graph: Practice
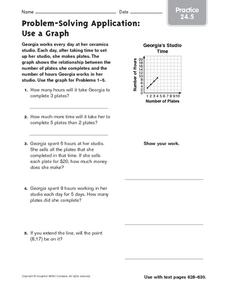
In this graphing coordinates worksheet, students study the graph and the coordinates. Students then answer the five questions about the graph and show their work.
Curated OER
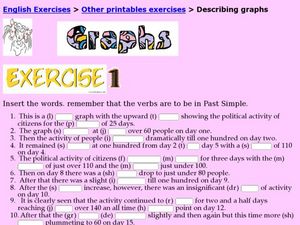
Describing Graphs
In this graphs learning exercise, learners fill in the blanks to sentences to describe graphs. Students complete 19 sentences total on this learning exercise.
Curated OER
Locating Points Using Cartesian Coordinates
Students discover coordinates as they explore Chicago. In this math lesson plan, students give the coordinates of a point, plot a point, and use the coordinate system in locating places on a map.
Curated OER
Graphs
Learners participate in a lesson exploring the concept of using graphs in various types of mathematical problems. They use negative and positive numbers in order to plot a graph. Students should use a place value chart for a reference...
Curated OER
Points as solutions
Ninth graders graph linear functions using coordinate points. In this algebra lesson, 9th graders plot points and graph a line. They use the slope intercept form to graph their equation and evaluate points as solution to the function.
Curated OER
More graphing situations by making a table
Students make a table and graph plotting points. In this algebra lesson, students graph linear equations on a coordinate plane. They calculate the rate of change and analyze the graph for extrapolation.
Curated OER
Points of Intersection
Eighth and ninth graders solve five different problems that include solving two equations. They determine the point of intersection in each of the five pairs of equations given. Pupils define point of intersection as the point where two...
Curated OER
This is the Way We Go To School
Second graders create and utilize a graph using the Excel computer program. They gather data regarding how the students get to school, tally the numbers for the class, and create a bar graph on paper and using Excel.
Curated OER
Graphing Ordered Pairs On A Coordinate Plane
Sinking ships, construction paper, coordinate planes, sounds like fun day in math class. Play the game Battleship with your class and reinforce the concept of graphing ordered pairs.
Curated OER
Read a Picture Graph
It's the Bears vs. the Seals! Who is the season winner? Read this data and have your math class answer the six questions that follow. Consider graphing the chart as a class, or encouraging individuals to graph it before answering the...
Curated OER
Ice Cream Lab
I scream, you scream, we all scream for ice cream! Even high schoolers enjoy making ice cream. This laboratory exercise has them record the temperature changes throughout the process of liquid becoming solid, graph the results, and...
Other popular searches
- Graphing Points Picture
- Graphing Points Activity
- Art From Graphing Points
- Graphing Points on a Grid
- Halloween Graphing Points


