Mathematics Vision Project
Module 9: Modeling Data
How many different ways can you model data? Scholars learn several in the final module in a series of nine. Learners model data with dot plots, box plots, histograms, and scatter plots. They also analyze the data based on the data...
Beyond Benign
Municipal Waste Generation
Statistically, waste may become a problem in the future if people do not take action. Using their knowledge of statistics and data representation, pupils take a look at the idea of waste generation. The four-part unit has class members...
Mathematics Vision Project
Module 4: Linear and Exponential Functions
Sequences and series are traditionally thought of as topics for the pre-calculus or calculus class, when learners are figuring out how to develop limits. But this unit uses patterns and slopes of linear functions in unique ways...
Curated OER
From Sea to Shining Sea
Students study the geography of the United States of America. Students write letters, create travel brochures, make maps, graph population numbers, read fiction and nonfiction selections, complete KWL charts, and watch films.
Mathematics Vision Project
Quadratic Equations
Through a variety of physical and theoretical situations, learners are led through the development of some of the deepest concepts in high school mathematics. Complex numbers, the fundamental theorem of algebra and rational exponents...
Texas Education Agency
Texas Gateway: Making Inferences/convincing Arguments About Samples/populations
Given problem situations that include given or collected data, the student will analyze the data and make inferences and convincing arguments based on the data.
PBS
Pbs: The Lowdown: Exploring Changing Obesity Rates Through Ratios and Graphs
In these KQED Lowdown infographics, explore how adult obesity rates in the United States, as measured by body mass index (BMI), have dramatically changed in the past half-century. A circular graph and a pictograph depict data by decade,...
Other
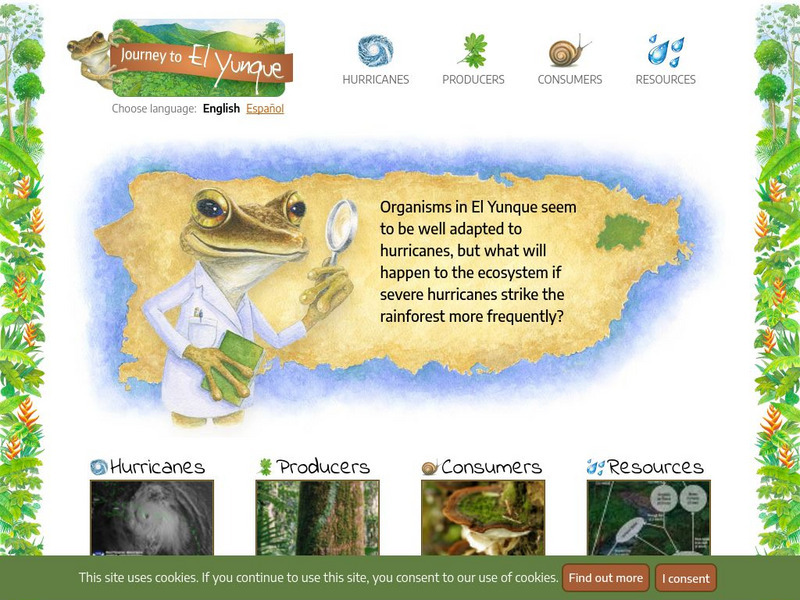
The Learning Partnership: Journey to El Yunque
In this set of learning modules, students examine the impact of hurricane weather on the El Yunque rainforest in Puerto Rico. They learn about hurricanes, producers, consumers, and the food chain, and how disruptions in organisms'...


