Science Buddies
Science Buddies: Interpreting Area Data From Maps vs. Graphs
Graphical methods of data presentation are a key feature of scientific communication. This project asks the question, "What's the best way to compare the land area of states: a map or a bar graph?" You'll be measuring performance on two...
Science Buddies
Science Buddies: Scientific Method Data Analysis/graphs
At the end of your experiment you should review all of the data you have collected. See samples of data analysis charts and graphs. Find out what makes for a good chart or graph using the self-grading rubrics.
Science Buddies
Science Buddies: An Experiment in Visual Perception
Graphical methods of data presentation are a key feature of scientific communication. This project will get you thinking about how to find the best way to communicate scientific information.
Discovery Education
Discovery Education: Science Fair Central: Investigation Set Up and Collect Data
A brief overview of how to gather both quantitative and qualitative data, complete with a sample data table.
Concord Consortium
Concord Consortium: Stem Resources: Greenhouse Light and Temperature
An interactive tool where students can create a model of a greenhouse and use a light sensor to measure the amount of light it receives from a lamp at various times of the day. Temperature is also measured. Data is plotted on graphs,...
Other
Tea: Some Like It Hot, Some Like It Cold Microbial Life
A science lab to determine the optimal temperature for common bacteria to grow. Students will graph their data to analyze and focus on bacteria that live in extreme conditions. To complete this experiment students will perform a gram stain.
Alabama Learning Exchange
Alex: My Peanut Butter Is Better Than Yours!
The students will engage in the process of statistical data comparing data using tables and scatterplots. The students will compare data using measures of center (mean and median) and measures of spread (range). This lesson can be done...
Alabama Learning Exchange
Alex: Box and Whisker With a Bed Sheet
The class will make a list of all of their classmates heights, ages in months, and shoe sizes. They will then use this data to create a human box-and-whisker plot. This lesson plan was created as a result of the Girls Engaged in Math and...
Other
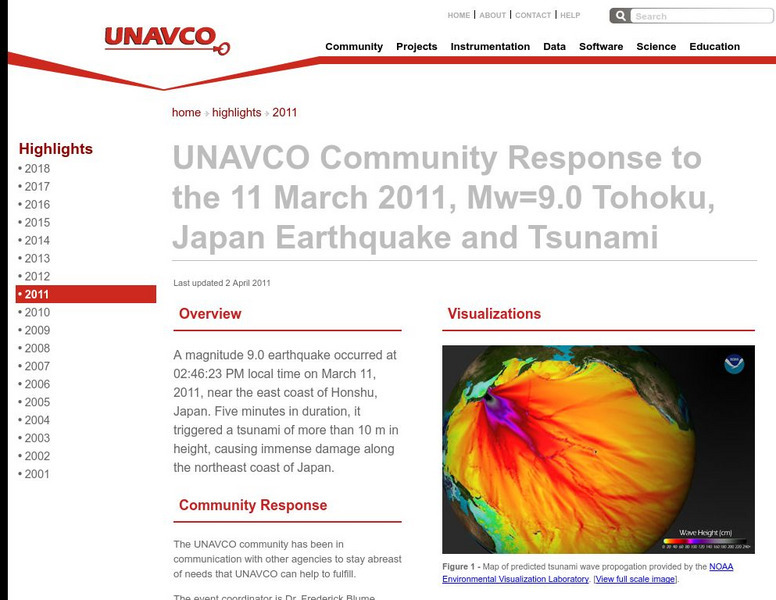
Unavco: Event Response to the Mw=9.0 Tohoku, Japan Earthquake and Tsunami
Relevant data connected to the earthquake as well as links to technical information and science websites. Also find many graphs and charts with information on the tectonic activity.


