Curated OER
Mean, Mode and Bar Graphs
For this mean, mode and bar graphs worksheet, 5th graders analyze the data given, then answer three questions about a bar graph and the data shown.
Curated OER
Every Graph Tells A Story
Seventh graders explore linear equations. In this graphing lesson plan, 7th graders explore constant rates of change. Students discover the real-life application of graphs and demonstrate their ability to read graphs and...
Curated OER
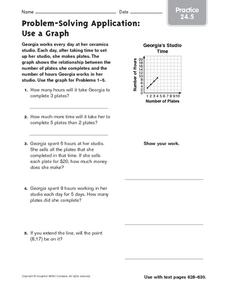
Problem-Solving Application: Use a Graph: Practice
In this graphing coordinates worksheet, students study the graph and the coordinates. Students then answer the five questions about the graph and show their work.
Curated OER
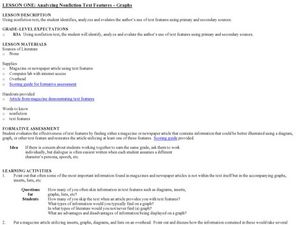
Analyzing Non-Fiction Text Features- Graphs
Students examine the text features of non-fiction. In this literacy lesson, students practice reading graphs and discover the authors intent for using them in primary and secondary sources.
Curated OER
Making Graphs
Students explore statistics by conducting class demographic surveys. In this graph making lesson, students identify the family members of each classmate, pets they own, and favorite activities. Students organize their statistics and...
Curated OER
A Statistical Study by Adolescent Students on Relevant Issues
Students use statistics to study attributes of a local center for pregnant teenagers. They apply mean, median, mode and a correlation study between two variables.
Curated OER
Double Bar Graphs
In this double bar graphs practice worksheet, students sharpen their problem solving skills as they solve 6 story problems.
Curated OER
Reading Graphs
In this reading graphs practice worksheet, students examine a graph and respond to 5 questions that require them to record the coordinates of 5 shapes on the gridded graph.
Curated OER
My Test Book: Reading Graphs
In this online interactive math skills worksheet, students solve 10 multiple choice math problems that require them to read and interpret graphs. Students may view the correct answers.
Curated OER
Analyzing Nonfiction Text Features - Graphs
Learners examine the text features of non-fiction. In this literacy lesson, students practice reading graphs and discover the authors intent for using them in primary and secondary sources.
Curated OER
Note-Taking Skills
Students take a closer look at their note-taking skills. In this communication lesson, students summarize information by taking notes using the various methods that their instructor presents to them.
Curated OER
Collecting And Organizing Data
In this collecting and organizing data worksheet, students, with a partner, problem solve and calculate the answers to six mathematical word problems.
Curated OER
Collect and Organize Data: Homework
In this collecting and organizing data worksheet, learners use the tally chart for the students' eye color to answer the first two questions. Learners then survey their family for eye color, record those results in a tally chart, and use...
Curated OER
Organizing and Interpreting Data
In this organizing and interpreting data worksheet, students solve and complete 10 different problems related to reading various data tables. First, they complete the 3 charts shown with the correct tally amount, frequency amount, and...
Curated OER
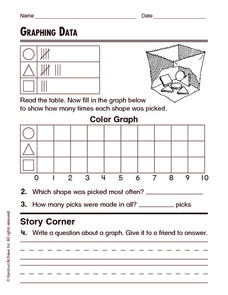
Graphing Data
In this graphing data worksheet, students solve and complete 8 different word problems related to graphing data given. First, they determine the percent of people who do not believe in any of the phenomena described and explain. Then,...
Curated OER
Conversation Hearts Graph: Valentine's Day
In this graphing conversation hearts worksheet, learners sort and count the colors of candy hearts, and determine which color had the most and least numbers. Students answer eight questions.
Curated OER
What's Data?
Students get the opportunity to investigate the concept of data collecting. They explore how to tally and read a bar graph. Vocabulary about data is also be included. At the end of the lesson, individual students collect data independently.
Curated OER
Making Logic Out of Madness
Tenth graders organize and interpret data from a student health program. In this physical education lesson, 10th graders use a body composition analyzer over 8 weeks to determine the validity of a student health program. ...
Curated OER
The Gathering and Analysis of Data
Young mathematicians gather data on a topic, graph it in various forms, interpret the information, and write a summary of the data. They present their data and graphs to the class.
Curated OER
Box and Whiskers
Middle schoolers discover how to relate collected data with a box and whiskers graph in a number of formats. They collect, organize, create, and interpret a box and whiskers graph. Pupils interpret the difference between sets of data,...
Curated OER
Interpreting Data from Birdfeeders
What kinds of birds live in your area? Read a book about birds to your learners and explore their feeding patterns. Charts and graphs are provided in this three page packet, but consider assigning the basic questions if using with young...
Curated OER
Special Ed. Resource
Ways to organize data is the focus of this math PowerPoint. Students view slides that define and give descriptions of a variety of graphs, and how mean, median, and mode are found. A good visual tool which should benefit almost all types...
Curated OER
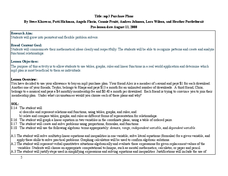
MP3 Purchase Plans
Use algebra to solve real world problems. Mathematicians practice use of graphs, tables, and linear functions to solve a problem regarding mp3 purchase plans. They work in groups to solve the problem and present their findings and...
Curated OER
Fire!, Probability, and Chaos
Upper elementary and middle schoolers work with the concept of probability. They are introduced to the concept of chaos. Learners graph and analyze using a line plot, work with mean, and are introduced to the concept of variance.
Other popular searches
- Graphing Skills Lesson Plans
- Basic Graphing Skills
- Organizing and Graphing Data
- Introducing Graphing Skills
- Graphing Skills Using M&ms
- Graphing Skills in Science
- Graphing Skills for Prek
- Graphing Skills With Fruits
- Graphing Skills in Chemistry
- Graphing Skills for Perk
- Graphing Skills Worksheet
- Reading Graphing Skills


