College Board
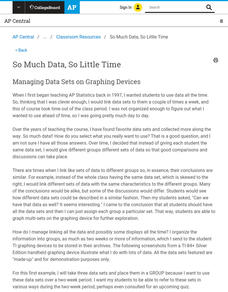
So Much Data, So Little Time
Organizing data in a statistics class is often a challenge. A veteran statistics teacher shares data organization tips in a lesson resource. The instructor shows how to group data to link to individual calculators in a more efficient...
College Board
Is That an Assumption or a Condition?
Don't assume your pupils understand assumptions. A teacher resource provides valuable information on inferences, assumptions, and conditions, and how scholars tend to overlook these aspects. It focuses on regression analysis, statistical...
Curated OER
Visual Literacy: Using Images to Increase Comprehension
A colorful PowerPoint is a great way to introduce the topic of visual literacy. The eye-catching presentation begins with an overview of visual literacy and then provides some specific strategies to help enhance reading comprehension. As...
EngageNY
TASC Transition Curriculum: Workshop 12
How can opinions slant facts? Workshop participants learn how to examine primary and secondary sources and identify the author's point of view. They also examine how visual art impacts the meaning and rhetoric of sources. Full of...
College Board
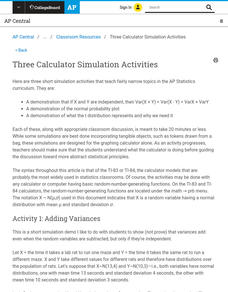
Three Calculator Simulation Activities
Calculators sure come in handy. An AP® Statistics instructional resource provides suggestions for using calculator simulations. It gives activities for adding variances, normal probability plots, and t distributions.
Other
Kindergarten lessons.com: Graphing Activities
Graphing activities for preschool and kindergarten include collecting data and organizing it in a variety of ways. There are lots of fun things to do in this area of math and the activities integrate well with science and literacy...
Other
National Council of Supervisors of Mathematics: Slope and Linear Functions
National Council of Supervisors of Mathematics: similarity, slope, and graphs of linear functions provides a teacher learning module, on how to effectively teach similarity, slope, and graphs to develop skill in reasoning about reasoning...
Louisiana Department of Education
Louisiana Doe: Louisiana Believes: Eureka Math Parent Guide: Problem Solving With Length, Money, and Data
A guide to support parents as they work with their students with problem solving with length, money, and data.
Other
Gphsf: Basic Project Timeline
This resource is a short piece, part of a larger page, on conducting your experiment. It contains a lot of good advice.
Florida Center for Reading Research
Florida Center for Reading Research: Essentials for Reading Success
This site offers three cyclical flow charts of the essentials for reading success: components of reading, types of assessment, and layers of instruction.
Other popular searches
- Graphing Skills Lesson Plans
- Basic Graphing Skills
- Organizing and Graphing Data
- Introducing Graphing Skills
- Graphing Skills Using M&ms
- Graphing Skills in Science
- Graphing Skills for Prek
- Graphing Skills With Fruits
- Graphing Skills in Chemistry
- Graphing Skills for Perk
- Graphing Skills Worksheet
- Reading Graphing Skills


