Other
Nearpod: Distance Time Graphs
For this lesson on distance-time graphs, students will understand graphing by analyzing distance-time graphs.
Science Education Resource Center at Carleton College
Serc: Investigating Motion Graphing Speed
In this introduction to motion activity, learners will get a personal understanding of speed and acceleration by experiencing it firsthand. Wheeled office chairs or other cart like devices are used to give one student a ride as a fellow...
CK-12 Foundation
Ck 12: Physical Science: Position Time Graphs
[Free Registration/Login may be required to access all resource tools.] How motion and speed can be represented by a distance-time graph and how average speed can be calculated from it.
Science Education Resource Center at Carleton College
Serc: Motion: Investigating Motion Graphs
For this lesson, students investigate motion graphs. Students predict what the distance-time graph and velocity time graph would look like for a student walking across the room for three different scenarios.
BBC
Bbc: Gcse Bitesize: Describing Motion Aqa
This lesson focuses on Distance-time graphs; the gradient of a distance-time graph represents the speed of an object.
CK-12 Foundation
Ck 12: Episd: Position Time Graphs
[Free Registration/Login may be required to access all resource tools.] Understand how to evaluate data presented in graphs based on speed and velocity calculations.
CK-12 Foundation
Ck 12: Plix: Motion: Position Time Graphs
[Free Registration/Login Required] Drag the red dot to draw a position-time graph for a sprinter with constant speed.
Alabama Learning Exchange
Alex: The Need for Speed
After viewing an introductory illustrated podcast on speed, distance, time, and velocity, students explore distance-time graphs using interactive websites. Working in cooperative learning groups, students will investigate the motion of...
Texas Instruments
Texas Instruments: Walk the Line: Straight Line Distance Graphs
In this activity, students' use a motion detector to create straight-line, or constant-speed, distance versus time plots, and analyze the linear equation that describes the plots.
Texas Instruments
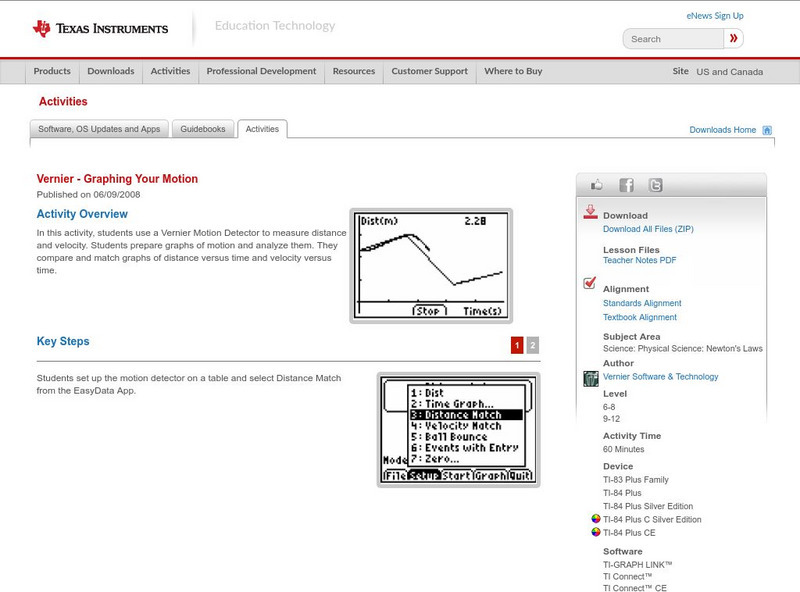
Texas Instruments: Graphing Your Motion
In this activity, students use a Motion Detector to measure distance and velocity. Students prepare graphs of motion and analyze them. They compare and match graphs of distance versus time and velocity versus time.
Texas Instruments
Texas Instruments: The Science of Racing: Time Laps
In this activity, you will create a picture of time and speed as they relate to changes in the weight of a radio controlled race car. This picture will be a graph - a mathematical model- that allows to you predict the speed of your radio...
Physics Aviary
Physics Aviary: Stopping Distance Lab
This lab is designed to have students find the relationships that affect the stopping distance and stopping time of a car on a roadway. Students will be able to modify the tires, road surface, the mass of the car, gravitational...
Texas Instruments
Texas Instruments: Falling Down Adventure 5
Students use the CBR 2 to study how a change in mass affects the average speed of a falling object. They graph distance as a function of time, and interpret and analyze graphs representing motion.
Physics Aviary
Physics Aviary: Speed of Sound Lab
This lab is designed to have students investigate the relationship between the distance from an explosion and the time it takes the sound of the explosion to reach the observer. The temperature of the air can be changed by changing the...
Science Education Resource Center at Carleton College
Serc: Discovering Velocity Outside of the Classroom
A physics lab activity where students gather data from classmates running at different rates on a football field. They then share their gathered data and transfer it to a graphing program to ultimately calculate average velocity.
PBS
Pbs Learning Media: Firefighter Training
In this video segment from Cyberchase, Harry decides to train as a firefighter and uses line graphs to chart his physical fitness progress.
Texas Education Agency
Texas Gateway: Changes in Motion
Given diagrams or scenarios, students will measure and graph changes in motion.
Texas Instruments
Texas Instruments: Match Me!
In this activity, students move in a specific way in front of the motion detector to create motion plots that match a given Distance versus Time plot. They make connections between types of movements and characteristics of Distance-Time...
CK-12 Foundation
Ck 12: Plix: Motion: Changing Speeds
[Free Registration/Login Required] Drag the red dot to draw a position-time graph for a sprinter with changing speeds.
Science and Mathematics Initiative for Learning Enhancement (SMILE)
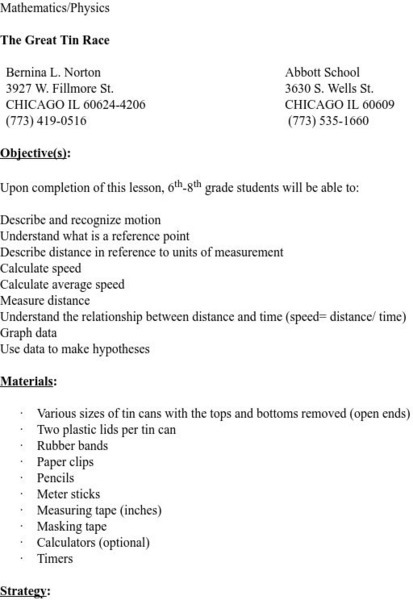
Smile: The Great Tin Race
This activity is a great way to show distance and time relationships while incorporating charts and graphing. Different sized tins are raced against each other, and data is collected.
Texas Instruments
Texas Instruments: A Steep Hike Adventure 3
Students use the CBR 2 to gather distance and time data for various walking speeds. They observe the effect of change in direction and speed of motion on distance versus time graphs. Students interpret and analyze graphs, calculate slope...
Texas Instruments
Texas Instruments: The Science of Racing: Hitting the Mark
Since running a race car is VERY expensive, race engineers know a great deal about how speed, time and distance relate. In this activity, you will investigate the relationship between distance traveled, speed and elapsed time. You will...
BBC
Bbc: Gcse Bitesize: Motion
This lesson focuses on motion including definitions, how to calculate the change in velocity and the average acceleration, and a link to an assessment.
CK-12 Foundation
Ck 12 Exploration Series: Simulations: Physics: Archery
[Free Registration/Login Required] Watch this animation as an archer shoots at a target on an angle, and its horizontal and vertical paths and its velocity are explained. An interactive follows where you can manipulate the archer's...


