Science and Mathematics Initiative for Learning Enhancement (SMILE)
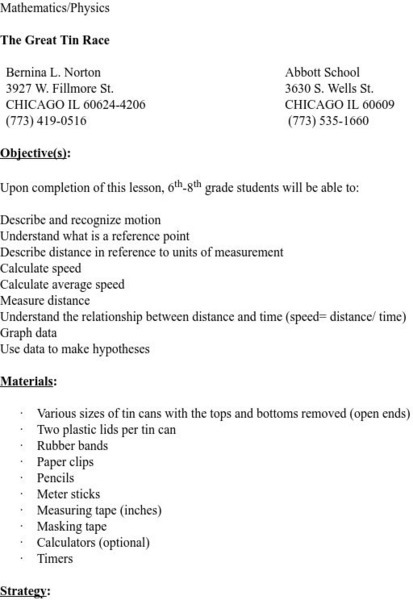
Smile: The Great Tin Race
This activity is a great way to show distance and time relationships while incorporating charts and graphing. Different sized tins are raced against each other, and data is collected.
Texas Instruments
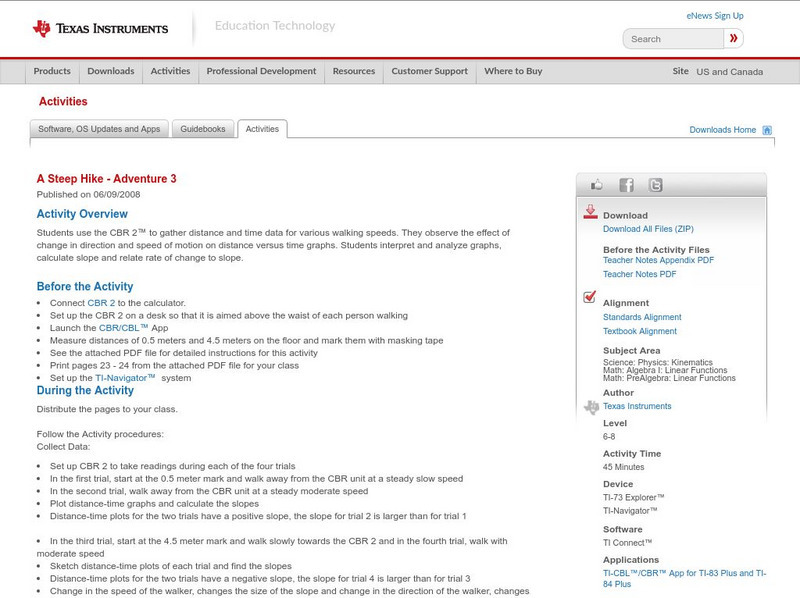
Texas Instruments: A Steep Hike Adventure 3
Students use the CBR 2 to gather distance and time data for various walking speeds. They observe the effect of change in direction and speed of motion on distance versus time graphs. Students interpret and analyze graphs, calculate slope...
Texas Instruments
Texas Instruments: The Science of Racing: Hitting the Mark
Since running a race car is VERY expensive, race engineers know a great deal about how speed, time and distance relate. In this activity, you will investigate the relationship between distance traveled, speed and elapsed time. You will...
BBC
Bbc: Gcse Bitesize: Motion
This lesson focuses on motion including definitions, how to calculate the change in velocity and the average acceleration, and a link to an assessment.
CK-12 Foundation
Ck 12 Exploration Series: Simulations: Physics: Archery
[Free Registration/Login Required] Watch this animation as an archer shoots at a target on an angle, and its horizontal and vertical paths and its velocity are explained. An interactive follows where you can manipulate the archer's...
Physics Aviary
Physics Aviary: Projectile Lab
This lab is designed to have students find the relationships that affect the horizontal distance travelled by a projectile. Students will be able to modify the starting height, initial speed and angle at which the projectile is fired....


