Curated OER
Acceleration and Average Speed
In this acceleration and average speed worksheet, students learn the equations for acceleration and average speed. They match 6 variables with their quantities, they identify speed vs. velocity and scalar vs. vector and they solve 4...
Curated OER
Hot Wheelin' Physics
For this physics worksheet, students complete a lab activity and record their results in the charts shown. They calculate the speed for each trial using the total time and total distance. Students also graph their results.
Inside Mathematics
Squares and Circles
It's all about lines when going around. Pupils graph the relationship between the length of a side of a square and its perimeter. Class members explain the origin in context of the side length and perimeter. They compare the graph to the...
Curated OER
Linear Motion: Speed, Velocity & Acceleration
Students explore the concept of linear motion. For this linear motion lesson, students calculate distance and time in order to calculate average speed and velocity in the provided problems.
Curated OER
Motion Graphs
In this motion graphs worksheet, students learn about how motion of objects can be described using a graph. Students then answer 10 fill in the blank, 10 short answer, and 5 problems to solve.
Curated OER
Bug Race
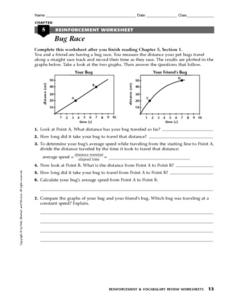
In this motion worksheet, students compare two graphs showing a bug's distance traveled over time. Students calculate the average speed of the bugs and determine which bug was traveling at a constant speed. This worksheet has 1 short...
Curated OER
Calculating Speed
Fourth graders complete an experiment on calculating speed. In this speed calculation activity students complete an activity in which they have dominoes fall as slow as possible.
Curated OER
Speed and Experiments
In this speed formula and scientific method worksheet, students read over descriptions of the formula an method. Students then respond to 12 matching, problem solving and short answer questions.
Curated OER
Worksheet 1 - Equation of a Line
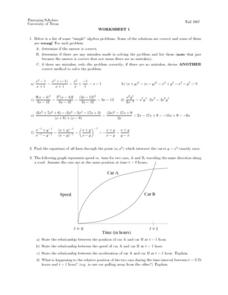
In this equation of a line worksheet, students determine the equation of a line, use the distance formula to identify the relationship between two moving objects, and solve inequalities algebraically. This two-page worksheet contains...
EngageNY
Searching a Region in the Plane
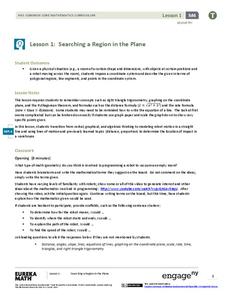
Programming a robot is a mathematical task! The activity asks learners to examine the process of programming a robot to vacuum a room. They use a coordinate plane to model the room, write equations to represent movement, determine the...
Concord Consortium
Cheetah's Lunch
Run like a cheetah. A performance task challenges pupils to solve several different problems involving the speed of a cheetah. Given information for scenarios where the cheetah chases its prey, they determine if the big cat is fast enough.
Curated OER
Faster speed-Shorter Time
Students calculate the inverse variation, and speed given the formulas. In this algebra lesson, students investigate properties of conics, focusing on the hyperbola. They identify the distance between the directrix and other parts...
Curated OER
Solar Speed
Students perform unit conversion. In this algebra lesson plan, students calculate the distance and speed of a solar car. They graph their result as speed versus distance and analyze it.
Curated OER
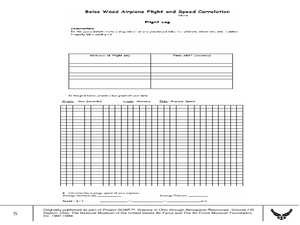
Balsa Wood Airplane Flight and Speed Correlation
Ninth graders calculate the average speed of their balsa wood airplane. In this physics lesson, 9th graders build their own airplane and make necessary modifications to to make it fly straight. They interpret distance and time graph...
Curated OER
Olympic Line Graphs
Sixth graders examine how to make line graphs. In this Olympic line graph lesson students make line graphs and search the given Internet sites to find data on their summer Olympic Game.
Houston Area Calculus Teachers
Collecting Driving Data
Give AP Calculus classes the opportunity to check the accuracy of their calculations! A calculus activity involves the collection of data, the application of mathematics, and the analysis of the accuracy of results. Young mathematicians...
Radford University
Midsummer Classic’s Homerun Derby
Hit a home run with your lessons. A two-part activity has learners explore quadratic equations that model the path of a baseball. They see how changing the initial speed of the ball affects its maximum height, maximum horizontal...
101 Questions
Scrambler
Unscramble a carnival mystery! Scholars observe a video of an overhead view of a carnival ride, The Scrambler. They then must determine mathematically where a specific car will stop after a certain amount of time.
Curated OER
Match Me!
Young learners explore motion graphs in this lesson. They investigate distance-time plots as they move in a specific way in front of the CBR in an attempt to make a motion plot that matches a given plot. Pupils explore the connections...
Mr. E. Science
Motion
An informative presentation covers motion, metric system, conversions, graphing of coordinates and lines, speed, velocity, and acceleration problems, as well as mean calculations. This is the first lesson in a 26-part series.
Curated OER
So Fast! So Slow!
Fifth graders give examples of objects that move slow and fast. In this physics instructional activity, 5th graders rank animals according to how quickly they move. They create a bar graph of organisms versus rates of speed.
Curated OER
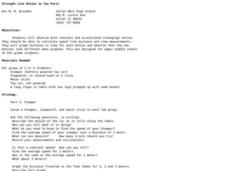
Straight Line Motion in Two Parts
Young scholars describe and quantify the motion of toy cars. In this motion instructional activity, students observe a battery powered toy car on a flat surface and a standard toy car on a sloped surface. They write their observations,...
Curated OER
How Does the Angle Effect How Fast a Car Will Travel?
For this angle of movement and speed worksheet, students determine at which angle a car will travel the fastest. They test 12 different angles on a toy car and determine from their data which angle is the best for speed.
Curated OER
Lesson Plan: Defining, Describing and Calculating Rate
Students view Cyberchase video to introduce calculating speeds. In this rate and distance lesson, students make original tables showing rate, distance and speed. Students analyze distance - time graphs for understanding.


