Curated OER
How Does Your Plant Grow?
Young scholars measure and record their height in centimeters on a graph. By integrating math and science, students collect data and apply graphing skills to the experiences they are having growing plants. Finally, young scholars...
Curated OER
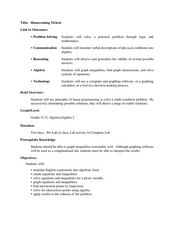
Homecoming Tickets
Students solve word problems using systems of equation. In this algebra lesson, students use computer and graphing to graph and analyze their solution. They solve system involving inequalities.
Curated OER
Observing Pods
Pupils observe the pistil growing into a tiny string bean-like seed pod. They then observe the development of the fertilized pods between Day 17 and Day 35 and record their observations by drawing and labeling, writing, and graphing. ...
Curated OER
What's The Point?
Students solve word problems using the correct math symbols. In this algebra lesson, students use the TI calculator to graph their equation and analyze it. They find the line of regression and use to draw conclusion.
Curated OER
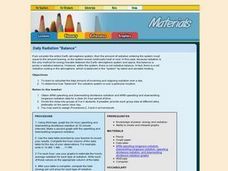
Daily Radiation "Balance"
Students explore the amount of radiation in the Earth's atmosphere. They calculate the total amount of incoming and outgoing radiation over a day and determine how "balanced" the radiative system is over a particular location.
Curated OER
Galileo's Battle for the Heavens
Students examine the nature of sunspot cycles and define solar minimums and maximums. In this sunspot lesson students construct and evaluate graphs of the current sunspot cycle.
Curated OER
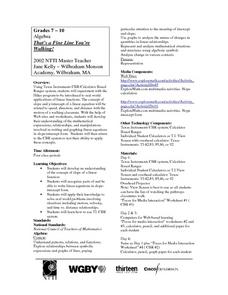
That's a Fine Line You're Walking!
Students experiment with Hiker program to practice real world applications of linear functions and develop their understanding of expressions, relationships, and manipulations involved in writing and graphing linear equations in...
Curated OER
Jelly Belly: What a Wonderful "Bean"!
Students explore how jelly beans are produced. They discuss the origins of the jelly bean and view a video about how jelly beans are prepared, tested, shaped, finished, and shipped and estimate the amount of jelly beans in a jar and sort...
Curated OER
Attributes of Accuracy
Middle schoolers explain necessity in using accurate instruments when measuring, and how measurements can be checked for accuracy. They make a six-inch ruler, design, test, and evaluate a system to measure work, and produce a table and...
Curated OER
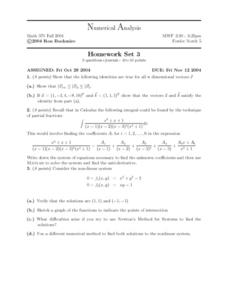
Numerical Analysis: Dimensional Vectors
In this dimensional vector worksheet, students prove dimensional vectors. They write systems of equations, verify solutions, and sketch graphs of the functions. This two-page worksheet contains approximately ten problems.
Curated OER
Linear-Quadratic Inequalities
High schoolers graph linear and quadratic functions. In this algebra lesson, students create graph with specific coordinate points. They use the Ti to visualise and differentiate between the two functions.
Curated OER
Linear Inequalities
In this algebra worksheet, learners solve linear inequalities. They graph their solution on a coordinate plane. There are 6 questions with answer key.
Curated OER
Quadratic Equations and Binomial Square Theorem
Learners factor quadratic equations. In this algebra lesson, students apply the binomial square theorem to solve quadratics. They complete the square and use the complex number system to solve for the roots.
Curated OER
Relating Distance and Velocity Over Time
Learners calculate the distance and velocity over time. In this algebra lesson plan, students graph a linear function to represent the distance vers time travel. They interpret their graphs and draw conclusion.
Curated OER
Body Proportion
Fourth graders measure the height and arm span of various classmates. They use a spreadsheet to design a graph that shows the class measurements from tallest to shortest in metric and standard systems.
Curated OER
work in pairs for the activities of this lesson which include researching and identifying butterflies, writing, and a brief oral presentation.
Young scholars explore the concepts of rdioactive decay and dating. They generate a radioactive decay table, use their data to plot a decay graph, develop the concept of half-life, and then use the graph to find the age of a mummified...
Curated OER
Algebra- Cell Phone Plans
High schoolers analyze graphs to compare cell phone plans. In this algebra lesson, students work together to analyze phone plans and report the best phone plan. High schoolers develop tables and graphs.
Curated OER
Worksheet 19
In this math worksheet, students use the following descriptions of a spring system to write a differential equation of the form my + γy + ky = F(x).
Curated OER
Mathematical Models with Applications: The Sounds of Music
Students use an electronic data-collection device to model the sound produced by a guitar string. They identify the graph of a periodic situation and use the graph to determine the period and frequency of sound waves.
Curated OER
Using Coordinate Geometry by Land, Sea and Outer Space.
Students complete a table of values and plot points, as well as construct a graph on a coordinate grid. They construct two graphs on the same coordinate system, and identify the point of intersection. Students represent and record...
Curated OER
Worksheet 28 - Spring 1996
In this math instructional activity, students examine the graph in polar coordinates of r = f(θ). Then they sketch a graph of the modified functions indicated.
Curated OER
Finding the Basal Area of a Forest Plot to Determine Stocking Levels
Learners use graphs and plots to measure the basal area and stocking levels. In this graphing instructional activity students work in the field the use their data to help them complete a lab activity.
Curated OER
Introduction to Parametric Equations
Students write and solve parametric equations. In this algebra activity, students find and eliminate parameter of equations. They graph parametric equations and analyze the graphs.
Curated OER
Inching Worms
Third graders have a blast trying to measure live, wiggly, stretching worms to the nearest inch. Groups record their data onto a class graph and then compare characteristics. They share their findings with the rest of the class. Fun...
Other popular searches
- Graphing Systems of Equations
- Solving Systems by Graphing
- Solving Systems Graphing
- Algebra Systems by Graphing
- Solve Systems by Graphing


