University of North Carolina
Figures and Charts
Sometimes words aren't the best way to get information across to the reader. The eighth handout in the 24-part Writing the Paper series describes different type of figures and charts to display complex information in a paper....
Math2
Math2
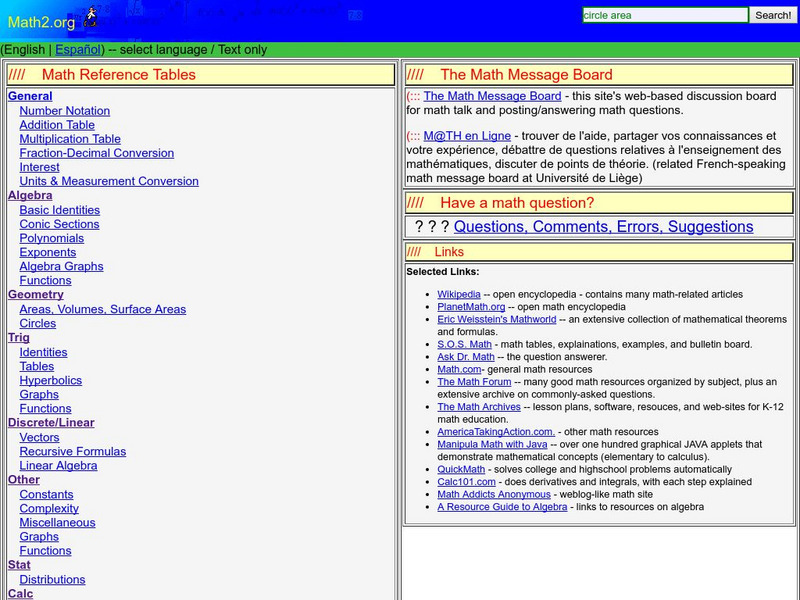
This is a site for students and teachers of all grade levels. If you are looking for math tables, general information about math topics, or you would like to ask a question, this is the site to visit.
University of Illinois
University of Illinois: Rollin' Rollin' Rollin'
This resource is the beginning of a series of pages that demonstrates the diffference between the mean and median of a group of numbers. Uses bar graphs to display the data.
Georgia State University
Georgia State University: Hyper Physics: Ionization Energies
A concise description of ionization energy, and a line graph that plots the ionization energies of the first 88 elements vs. the atomic numbers.
US Census Bureau
Us Census Bureau: International Data Base
Statistical data on the population and demographics of 228 countries, including change, sex ratios, life expectancy, and percent with HIV/AIDS. There are also detailed explanations of the means of producing these statistics. It is...
Other
The Nebraska Department of Economic Development
A fountain of information about the Nebraska of today. Includes population statistics, loads of graphs and tables, imports, exports, etc.
CK-12 Foundation
Ck 12: Using the First and Second Derivative Tests
[Free Registration/Login may be required to access all resource tools.] This resource gives a step by step account of how to apply knowledge from First and Second Derivative Tests to sketch graphs of functions. The following table...


