Curated OER
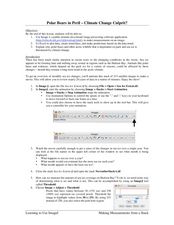
Polar Bears in Peril - Climate Change Culprit?
Students explore the changes in sea ice over several years. In this life science lesson plan, students review and examine 20 years of data. They use Excel to graph data and analyze trends.
Curated OER
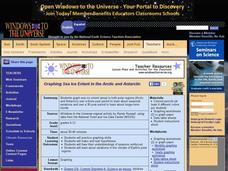
Graphing Sea Ice Extent in the Arctic and Antarctic
Students graph sea ice data and predict long term trends in the data. In this climate change lesson, students use sea ice data from the Arctic and Antarctic to construct line graphs. They use their graphs to predict the effects of global...
Curated OER
Snow Cover by Latitude
Students create graphs showing the amount of snow coverage at various points of latitude and compare graphs.
Curated OER
Creating Climographs
Students use satellite data to compare precipitation and surface temperatures on different islands. In this satellite lesson plan students create graphs and explain the differences between weather and climate.
Curated OER
Getting to the Core of Climate Change
Young scholars investigate climate changes by graphing and analyzing ice core data from Greenland and Antarctica. They create, explain and report the pattern of data on a graph of ice core data. In addition they find relationships...
National Energy Education Development Project
Introduction to Wind Energy
The U.S. produced enough wind energy in 2015 to power all of the homes in Alaska, California, Delaware, the District of Columbia, Hawaii, Idaho, Maine, Montana, Nebraska, New Hampshire, North Dakota, Rhode Island, South Dakota, and...
Curated OER
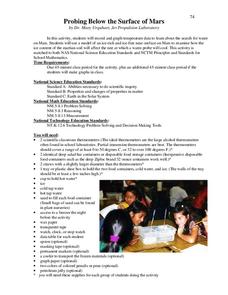
Probing Below the Surface of Mars
Learners simulate the search for water in Mars using simple apparatus. In this space science activity, students explain how soil temperature affects the cooling of probes. They graph the data collected from the simulation.
Curated OER
Snow Cover By Latitude
Students create graphs comparing the amount of snow cover along selected latitudes using data sets from a NASA website. They create a spreadsheet and a bar graph on the computer, and analyze the data.
Curated OER
Sea and Ice Salinity
Students conduct an experiment. In this salinity lesson, students learn about sea ice, why it is important and how changing amounts can affect the sea. Students conduct an experiment to find out the effects of salinity on the...
Curated OER
Global Meltdown
In this environmental science lesson, students study data and animation on global temperature increase to complete 8 short answer questions that follow.
Curated OER
Guetemala's Changing Forest
Eighth graders compare their local ecological zone to the tropical rainforest. In this natural ecology lesson, 8th graders complete an activity about the differences in ecological zones. They compare their biome to the Guatemalan...
Curated OER
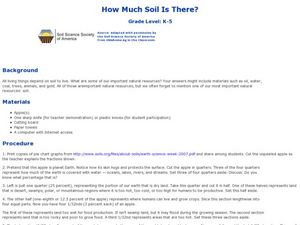
How Much Soil is There?
Students examine that all living things depend on soil to live. In this science lesson, students pretend that an apple is planet Earth. Students cut the apple to represent the portions of Earth with the last section representing soil.
National Earth Science Teachers Association
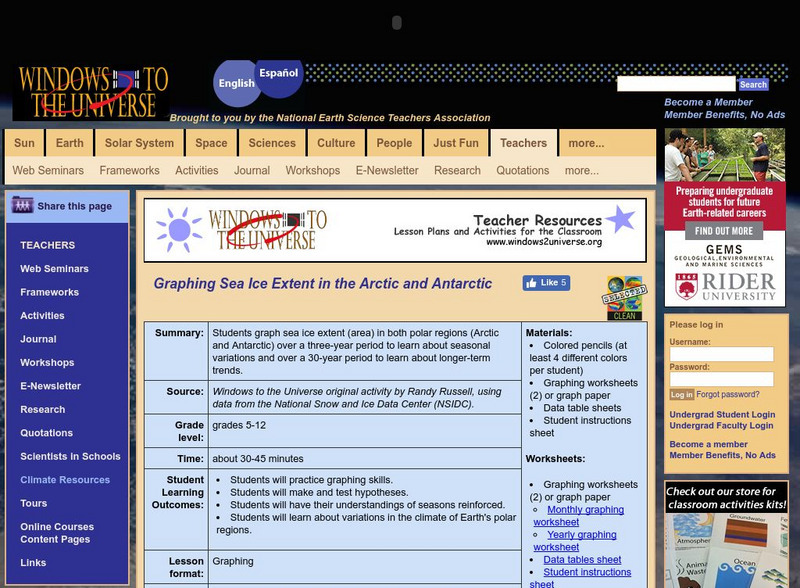
Windows to the Universe: Graphing the Extent of Sea Ice in Arctic and Antarctic
Students graph sea ice extent in both polar regions over a three-year period to learn about seasonal variations, and over a 30-year period to learn about longer-term trends.
