Shodor Education Foundation
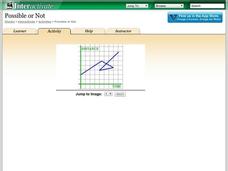
Possible or Not?
What does the graph mean? Pupils view 10 graphs and determine whether they are possible based on their contexts. The contexts are distance versus time and profit versus time.
Curated OER
Fast Food Survey Using Bar Graphs
Second graders create a bar graph to pictorically represent the data collected from a survey of students. They use Excel to electronically create the graphs and data tallies. They then interpret their data using sentences to explain.
Curated OER
All About Graphs
Students practice organizing data by creating graphs. For this statistics lesson, students survey the class about favorite colors and create a bar graph using the data. Students complete a test based on pet and animal statistics.
Curated OER
M&M Graphing and Probability
Students sort, classify, and graph M & M's. They create pictographs and bar graphs with the colors and numbers in each bag of M & M's. They calculate the ratio and probability based on class results.
Curated OER
Histograms and Bar Graphs
Students examine the use of bar graphs and histograms. In this data representation lesson, students investigate the proper use of bar graphs and histograms to represent data. They learn the proper geometric definitions, experience direct...
Curated OER
7th Grade Math Circle Graphs
Seventh graders are able to develop (synthesis) pie graphs with the class and on their own. They are told that pie charts are a graphic representation of material that can be given in the form of parts of a whole by using...
Curated OER
Charts, Maps, and Graphs Lesson on the Holocaust
Students practice interpreting data. In this Holocaust lesson, students research selected Internet sources and examine charts, maps, and graphs regarding the Jewish populations in and out of Europe. Students respond to questions about...
Curated OER
Class Birthday Graph
Students analyze the basics of an Excel spreadsheet. They highlight cells in a spreadsheet. They make a column graph. Students are introduced to X-axis and Y-axis. They play various address games on the spreadsheet.
Curated OER
Favorite Candy Bar Graph
Students decide on six different types of candy bars to include in a data collection activity. Working in small groups, they survey a target group in a set amount of time. They access a Internet based graphing tool to create a bar graph...
Physics Classroom
Dots and Graphs
Scholars demonstrate understanding of kinematic graphs through matching dot graphs to position time graphs, dot graphs to velocity graphs, and a mixture of the two. If users feel stuck or confused, a Help Me! button offers an explanation...
Physics Classroom
Match That Graph
Matchy-matchy no longer exclusively applies to fashion. Scholars work through three levels of practice matching position and velocity graphs. Part of a series covering dimensional kinematics, each question provides immediate feedback and...
Physics Classroom
Position-Time Graphs
Three sections review the key skills covered in a series on dimensional kinematics. The first covers the difference between distance and displacement. The second addresses the relationship between velocity and slope. The third includes...
Curated OER
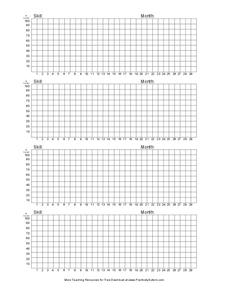
Skills Graph: Template
It doesn't matter what disability your pupil has, if he has an IEP, you'll have to show he has met his goals. Included here is a series of 4 graphs which allow you to chart the skill, month, and percentage correct. I have used of this...
Teach Engineering
Complex Networks and Graphs
Show your class how engineers use graphs to understand large and complex systems. The resource provides the beginnings of graph theory by introducing the class to set theory, graphs, and degree distributions of a graph.
Education World
Putting Turkey on a Table (or a Graph)
Grateful learners put turkey on a table (or a graph)! Through a creative project they show statistical information about turkey population, production, and consumption. A great Thanksgiving lesson that can be applied at any time to the...
Curated OER
Are You Full of Hot Air?
Explore the concept of measuring and recording circumference. For this physical science and measurement lesson, young learners blow up balloons, measure the circumference, and record the data on an interactive graphing website.
Curated OER
Iron For Breakfast
Third graders are challenged to use scientific thinking, they experiment and observe which objects are attracted to a magnet. Pupils use the evidence to construct an explanation as to what common property the objects attracted to a...
Shodor Education Foundation
InteGreat
Hands-on investigation of Riemann sums becomes possible without intensive arithmetic gymnastics with this interactive lesson plan. Learners manipulate online graphing tools to develop and test theories about right, left, and midpoint...
CK-12 Foundation
Graphs of Absolute Value Equations: Absolute Value Distance
The sole purpose of this interactive is to graph a function representing the distance of a car from a shoe store. Scholars use an interactive to graph such an absolute value function. They then answer a set of challenge questions...
Curated OER
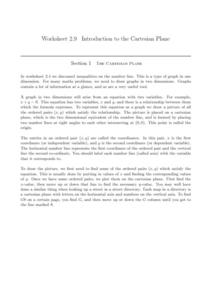
The Cartesian Plane
Learners solve and complete 22 various types of problems. First, they find the gradients of the lines and plot the given points. Then, they complete the table of values for each equation and use the table to draw the graph.
Curated OER
Nutrition and Food Security
Examine the three basic nutrients and their effects on the body. Fifth graders will research data to construct a bar graph and then demonstrate the relationship between malnutrition and food security. This is a very comprehensive...
Curated OER
Matrix Analysis of Networks
Explore the connection between a finite graph, a directed graph, and a matrix. Graph lines and identify the relationship of matrices in real-world scenarios. Then use this information to work with a partner to plan and design a town...
Curated OER
Does cloud type affect rainfall?
Student use MY NASA DATA to obtain precipitation and cloud type data. They create graphs of data within MY NASA DATA. Students compare different cloud types, compare precipitation, and cloud type data They qualitatively describe graphs...
Curated OER
Level III: Technology Integration
Fourth graders prepare two spreadsheets each with an embedded line graph that displays data about the growth of the bitter rot fungus on apples and on petri dishes that were stored in the refrigerator and the classroom. They prepare a...


