EngageNY
Properties of Trigonometric Functions
Given a value of one trigonometric function, it is easy to determine others. Learners use the periodicity of trigonometric functions to develop properties. After studying the graphs of sine, cosine, and tangent, the lesson connects...
EngageNY
Revisiting the Graphs of the Trigonometric Functions
Use the graphs of the trigonometric functions to set the stage to inverse functions. The lesson plan reviews the graphs of the basic trigonometric functions and their transformations. Pupils use their knowledge of graphing functions to...
EngageNY
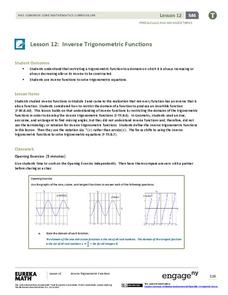
Inverse Trigonometric Functions
Build on the understanding of finding angles using trigonometric ratios. Pupils develop the definitions of inverse trigonometric functions by restricting their domains in the 13th lesson of a 16-part series. They use inverse functional...
EngageNY
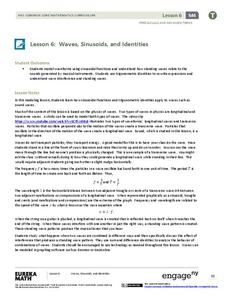
Waves, Sinusoids, and Identities
What is the net effect when two waves interfere with each other? The lesson plan answers this question by helping the class visualize waves through graphing. Pupils graph individual waves and determine the effect of the interference...
Illustrative Mathematics
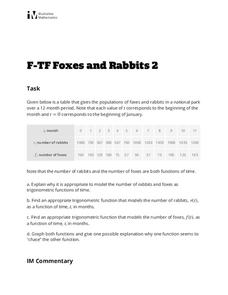
Foxes and Rabbits 2
The fox population chases the rabbit population. Groups model the populations of foxes and rabbits with two trigonometric functions. Individuals graph both trigonometric models on the same graph, and then teams determine an explanation...
Concord Consortium
Broken Spreadsheet II
Work in reverse with the product becoming the given. Using a spreadsheet image of the graph of a trigonometric function, young scholars investigate methods of creating spreadsheet data that results in the given graph. The catch? The data...
Illustrative Mathematics
Foxes and Rabbits 3
Model periodic populations. Here, in the context of foxes and rabbits, pupils look at graphs of the populations of these animals in a national park over a span of 24 months. Groups analyze the graphs and determine trigonometric...
Inside Mathematics
Hopewell Geometry
The Hopewell people of the central Ohio Valley used right triangles in the construction of earthworks. Pupils use the Pythagorean Theorem to determine missing dimensions of right triangles used by the Hopewell people. The assessment task...
EngageNY
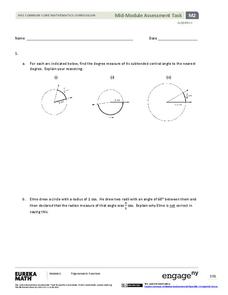
Algebra II Module 2: Mid-Module Assessment
Time for classes to show what they've learned. Use several tasks to assess understanding of the trigonometric functions, unit circle, radians, and basic trigonometric identities.
Illustrative Mathematics
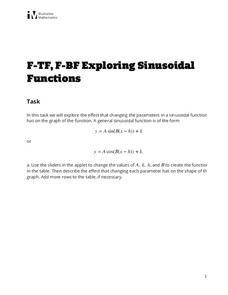
Exploring Sinusoidal Functions
What effect does changing a parameter have on the graph of a trigonometric function? Pupils use a Desmos applet to explore the general sine graph. They experiment changing different parameters and record the resulting change of the...
Concord Consortium
Sine Solution
How many times can eager mathematicians catch the waves? Pupils find the solutions of three different trigonometric equations. They then determine the effect of the slope of a line that intersects a trigonometric function and the number...
Illustrative Mathematics
Hours of Daylight 1
The midline of the mathematical model of the number of hours of sunlight is not 12 hours. Pupils use the modeling cycle to determine a function that will model the number of hours of sunlight at a location of their choosing. Using...
EngageNY
Algebra II Module 2: End-of-Module Assessment
Will this be on the test? Learners demonstrate their understanding of trigonometric functions with an end-of-module assessment. They investigate two different real-world situations, one function in pure mathematics, and one...
EngageNY
Mid-Module Assessment Task: Pre-Calculus Module 4
Challenge scholars to show what they know about properties and addition and subtraction formulas for trigonometric functions. The resource provides a mid-unit check on the progress toward mastery of trigonometric concepts. The areas...
Concord Consortium
Here Comes the Sun
Many phenomena in life are periodic in nature. A task-based lesson asks scholars to explore one of these phenomena. They collect data showing the sunrise time of a specific location over the period of a year. Using the data, they create...
Curated OER
Foxes and Rabbits 3
Use realistic data to find trigonometric models that best fit the populations of foxes and rabbits in a national park. Included are detailed explanations of the answers and process. This is a follow-up exercise to the lesson listed in...
Curated OER
Foxes and Rabbits 2
Explore the relationship between the population of foxes and rabbits in a national park using trigonometric models. Plot data and find the appropriate trigonometric functions. Two questions require interpretation and explanation of...
Oswego City School District
Regents Prep: Applications of Trigonometric Graphs
Students can use this site to practice questions dealing with trigonometric graphs. Students are challenged with multiple real-world problems and after solving those problems they can check their solution online.
Khan Academy
Khan Academy: Algebra Ii: Amplitude of Sinusoidal Functions From Graph
Given the graph of a sinusoidal function, determine its amplitude. Students receive immediate feedback and have the opportunity to try questions repeatedly, watch a video or receive hints.
Khan Academy
Khan Academy: Amplitude of Sinusoidal Functions From Graph
Given the graph of a sinusoidal function, determine its amplitude.
Math Graphs
Houghton Mifflin: Math Graphs: Fitting Models to Scatter Plots 1 [Pdf]
Learners use a scatter plot to determine whether data can be modeled by a linear function, a quadratic function, a trigonometric function, or that there appears to be no relationship between x and y. The resource consists of an enlarged...
Math Graphs
Houghton Mifflin: Math Graphs: Fitting Models to Scatter Plots 2 [Pdf]
Students use a scatter plot to determine whether data can be modeled by a linear function, a quadratic function, a trigonometric function, or that there appears to be no relationship between x and y. The resource consists of an enlarged...
Math Graphs
Houghton Mifflin: Math Graphs: Fitting Models to Scatter Plots 3 [Pdf]
Students use a scatter plot to determine whether data can be modeled by a linear function, a quadratic function, a trigonometric function, or that there appears to be no relationship between x and y. The resource consists of an enlarged...
Math Graphs
Houghton Mifflin: Math Graphs: Fitting Models to Scatter Plots 4 [Pdf]
Students use a scatter plot to determine whether data can be modeled by a linear function, a quadratic function, a trigonometric function, or that there appears to be no relationship between x and y. The resource consists of an enlarged...









![Houghton Mifflin: Math Graphs: Fitting Models to Scatter Plots 1 [Pdf] Unknown Type Houghton Mifflin: Math Graphs: Fitting Models to Scatter Plots 1 [Pdf] Unknown Type](https://d15y2dacu3jp90.cloudfront.net/images/attachment_defaults/resource/large/FPO-knovation.png)