Texas Education Agency
Texas Gateway: The Language of Physics: Physical Quantities and Units
By the end of this section, you will be able to associate physical quantities with their International System of Units (SI) and perform conversions among SI units using scientific notation; relate measurement uncertainty to significant...
Varsity Tutors
Varsity Tutors: Hotmath: Graphing Calculator Practice Problems Areas and Volumes
Practice using your graphing calculator for area and volume problems. If you get stumped or if you would like to check your work, then select the View Solution button, which is located directly under each problem.
Oswego City School District
Regents Exam Prep Center: Multiple Choice Practice: Coordinate Geometry
Test your knowledge of coordinate geometry by taking this twenty question multiple-choice practice test. Use a graphing calculator to help with any graphing problems and check your answers at any given time throughout the test.
Oswego City School District
Regents Exam Prep Center: Graphically Represent the Inverse of a Function
Investigates how to graph the inverse of a function. There is also an explanation that involves the use of a graphing calculator.
Illustrative Mathematics
Illustrative Mathematics: F If.6 Mathemafish Population
For this task, learners are presented with a table and a graph and are asked to summarize the data and report the findings of a project by the Environmental Protection Agency to contain the effects of an invasive species on a fish...
Texas Instruments
Texas Instruments: Numb3 Rs: Exponential Growth
Based off of the hit television show NUMB3RS, this lesson introduces students to the concept of exponential growth, especially in comparison to linear growth. This is done in the context of weekly allowances, in which one group earns a...
Khan Academy
Khan Academy: Lesson Summary: Fiscal Policy
In this lesson summary review and remind yourself of the key terms, calculations, and graphs related to fiscal policy. Topics include how taxes and spending can be used to close an output gap, how to model the effect of a change in taxes...
Illustrative Mathematics
Illustrative Mathematics: 6 Sp.2,5d Electoral College
In addition to providing a task that relates to other disciplines (history, civics, current events, etc.), this task is intended to demonstrate that a graph can summarize a distribution as well as provide useful information about...
Oswego City School District
Regents Exam Prep Center: Multiple Choice Practice: Working With Data
Test your knowledge of working with data by taking this twenty question multiple-choice practice test. Use a graphing calculator to help with any graphing problems and check your answers at any given time throughout the test.
Texas Instruments
Texas Instruments: Discovering Ohm's Law
In this activity, students use voltage and current probes to investigate Ohm's Law. The students collect data and use their graphing calculators to perform data analysis and "discover" Ohm's Law.
TeachEngineering
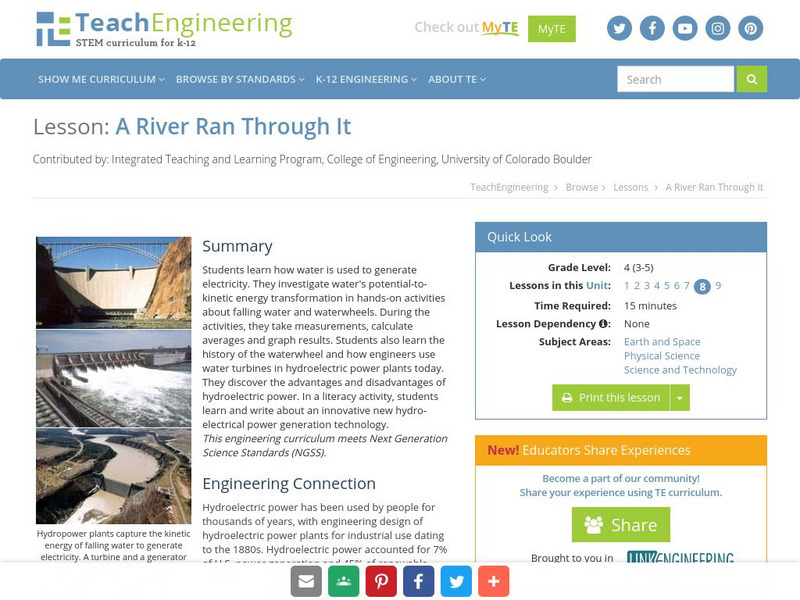
Teach Engineering: A River Ran Through It
Students learn how water is used to generate electricity. They investigate water's potential-to-kinetic energy transformation in hands-on activities about falling water and waterwheels. During the activities, they take measurements,...
Texas Instruments
Texas Instruments: Election Night With Percent
The students will be working primarily with the concept of % of a number. They will calculate the number of people expected to vote when given the population and % of registered voters along with historical data on percentage of voter...
Oswego City School District
Regents Exam Prep Center: Multiple Choice Practice: Equations and Inequalities
Check your understanding of equations and inequalities by completing this multiple-choice practice test. You may use a graphing calculator to solve the problems and check your answers at any given time.


