Curated OER
Bullying-studying it to curb it....
Students will engage in a variety of research activities to write what the latest facts are concerning the issue of bullying. This issue is relevant to the lives of learners in schools, which will make for an high interest lesson.
Curated OER
Lesson 3: Understanding Population Growth
Students explain population growth in Maryland and its relationship with age structure, household growth and consumption of land.
Curated OER
Free African-Americans in Delaware
Students work in groups of two and review the Abolitionist Movement. They observe the manumission/city directory and discover what it is and why it is so important. They read the manumission aloud and discuss why they were freeing their...
US Census Bureau
Us Census Bureau: International Data Base
Statistical data on the population and demographics of 228 countries, including change, sex ratios, life expectancy, and percent with HIV/AIDS. There are also detailed explanations of the means of producing these statistics. It is...
University of Regina (Canada)
University of Regina: Math Central: Circle and Bar Graphs
Students evaluate data, use the data to make different types of graphs, and then investigate these graphs. Teacher's notes are included along with downloadable versions of the activity. This lesson is from a group of lessons that uses...
PBS
Wnet: Thirteen: Circle Graph Analysis and Creation
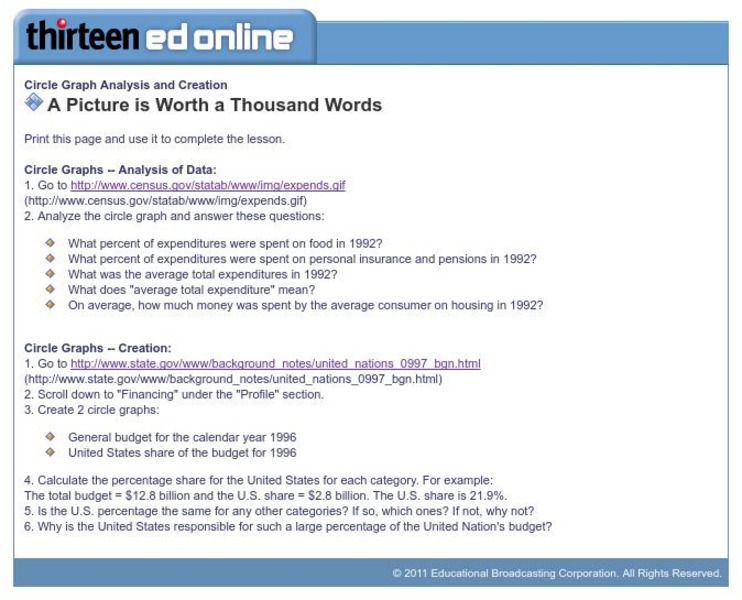
This site, which is provided for by WNET, gives a great way to practice using circle graphs through these exercises. One is analyzing a pie graph from the Census Bureau and the other creating pie charts using government data.


