Curated OER
Scatter Plots
Seventh graders investigate how to make and set up a scatter plot. In this statistics lesson, 7th graders collect data and plot it. They analyze their data and discuss their results.
Curated OER
Compare and Contrast
Students graph equations using the y-intercept. In this algebra lesson, students investigate functions based their slope and y-intercept. They learn to analyze graphs by comparing the y-intercepts of the graphs.
Curated OER
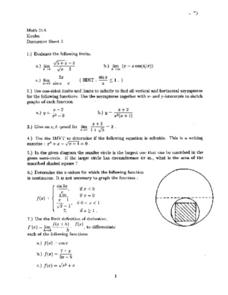
Discussion Sheet 3: Limits
In this limit learning exercise, students evaluate limits and use asymptotes and intercepts to sketch graphs of functions. They determine the area of inscribed shapes and use the limit definition of a derivative to differentiate...
Curated OER
Lines of Best Fit
Students explore the concept of line of best fit. In this line of best fit lesson, students find lines of best fit in examples about riding your bike home from school and dentistry. Students find two data points and find the line of best...
Curated OER
My Peanut Butter is Better Than Yours!
Learners explore the concept of statistical data. In this statistical data lesson, students read an article about the dangers of peanut butter to those who are allergic. Learners perform a taste test of two different brands of peanut...
Curated OER
Linear Progression
Students use graphing calculators to graph lines and create tables of values. They perform an experiment using M&M's and slinkys, then create their tables based on their results.
Curated OER
Mathematics Within: Algebraic Patterns
Students discover patterns in linear equations by playing a dice game to collect data. They graph the data and analyze the patterns of the lines created by the data. The class then compares the individual graphs to evaluate the position...
Curated OER
Worksheet 7, Polynomials
In this algebra worksheet, students graph 3 polynomial functions. They find the intercepts, and the intervals above the x axis. Students create their own polynomials with given characteristics.
Curated OER
Lesson Plan On Fran Data
Seventh graders investigate the concept of functions and how they are used in the context of the real world while identifying the dependent and independent variables. They graph relations and functions and find the zeros of functions....
Curated OER
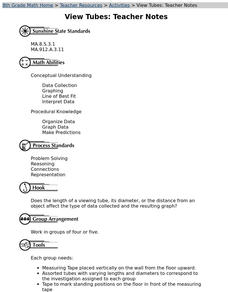
View Tubes
Eighth graders decide if the length of a viewing tube, its diameter, or the distance from an object affects the type of data collected and the resulting graph through a series of experiments.
Curated OER
The Box Problem
Students investigate the concept of functions and how they are used with polynomials. They practice finding the zeros of functions and graph polynomial functions for the help of giving solutions. Students interpret the curve of a line...
Curated OER
Fitting a Line to Data
Students work together in groups to collect data in relationship to how much water marbles can displace. After the experiment, they use the data to identify the linear equation to determine the best-fit line. They use the equation to...
Curated OER
Classifying Functions
Eleventh graders sort different types of functions including rational, periodic, exponential, polynomial, quadratic, logarithmic and linear using "function cards." The functions are displayed in multiple representations including...
Curated OER
Water: On the Surface and in the Ground
Pupils explore the differences between surface water and ground water. They collect data using maps and graphs and investigate a Texas river basin and a nearby aquifer. They complete a written report including maps and data regarding the...
Curated OER
Water-Is There Going to be Enough?
High schoolers research the availability, usage and demand for water in the local area historically and use projections of the availability, usage and demand for water up to the year 2050. They gather data and present the information in...
Curated OER
High School Mathematics Problems from Alaska: Jesse Thomas Moose Hide Problem
Students solve problems about a student earning money for college by tanning moose hides.
EngageNY
End-of-Module Assessment Task - Algebra 2 (Module 3)
The last installment of a 35-part series is an assessment task that covers the entire module. It is a summative assessment, giving information on how well pupils understand the concepts in the module.
Curated OER
Kinetics of acetone iodination
In this chemistry worksheet, learners examine the given concept in order to apply in the laboratory setting. The sheet includes in depth background information.
Curated OER
Algebra 1
Students study the functional relationships of a variety of problems. In this functional relationship activity, students determine the dependent and independent quantities of a given set of data. Students record the data and...
Curated OER
Math Honors 2: Semester 1 Review
For this worksheet, learners review topics from Algebra 2. Topics include synthetic division, rational algebraic expressions, quadratic functions, imaginary number, composite functions, and inverse of a function. The three-page worksheet...
Curated OER
Fundamental Theorem of Algebra
In this worksheet, learners identify the Fundamental Theorem of Algebra. They solve polynomial functions and simplify expressions and equations.
Alabama Learning Exchange
Investigating School Safety and Slope
Learners investigate the slope of various stairways through a "news report" approach and employ mathematical knowledge of applied slope to report on wheelchair accessibility and adherence to Americans with Disabilities Act. They...
Curated OER
Forms of Equations
Ninth graders discuss the different forms of equations. For this algebra lesson, 9th graders talk about the pros and cons of algebraic equations. They discuss reflection across the x and y axis and write out the equation of the given...
Curated OER
Himalayan Herds: Fractional Exponential Growth
Students solve problems by identifying exponential growth and decay and differentiating between patterns, relation and functions. In this algebra lesson, students apply concepts of exponential growth to solve problems.


