Concord Consortium
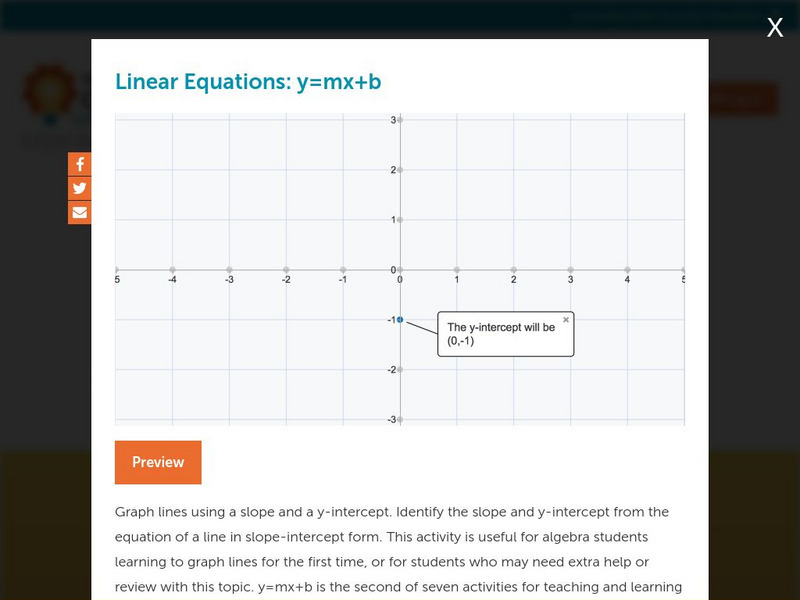
Concord Consortium: Linear Equations: Y=mx+b
Graph lines using a slope and a y-intercept. Identify the slope and y-intercept from the equation of a line in slope-intercept form.
Texas Instruments
Texas Instruments: Cabri Jr. The Equation of a L Ine
This activity uses Cabri Jr. to graph a line and show the equation of the line. The equations for oblique, horizontal and vertical lines are explored with emphasis on slope and y-intercept.
Texas Instruments
Texas Instruments: Glencoe Science: Endothermic and Exothermic Process
Students can use TI graphing calculators and data collection to find equations of lines using slope-intercept format and graph.
Texas Instruments
Texas Instruments: Getting Started With the Ti Navigator: What's My Line
This lesson introduces students to Activity Center and is intended to help students understand the meaning of slope and y-intercept. They will explore the relationships between symbolic expressions and graphs of lines by using Activity...
Alabama Learning Exchange
Alex: Math Is Functional
This lesson is a technology-based activity in which students extend graphing of linear functions to the use of spreadsheet software. After students have become proficient in constructing a table of values, students are able to...
Purple Math
Purplemath: Solving Polynomials: How To
Demonstrates the steps involved in solving a general polynomial, including how to use the Rational Roots Test and synthetic division. Points out when using a graphing calculator can be very helpful.
Purple Math
Purplemath: Factoring Polynomials: How To
Demonstrates the steps involved in factoring a general polynomial, including using the Rational Roots Test and synthetic division. Shows how to "cheat" with a graphing calculator.
Curated OER
Webmath.com: Graph a Line
WebMath.com offers a java applet that allows you to input the slope of a line and a point on the line and gives you the equation, in slope-intercept form, of the line with the given slope that passes through the point. It also includes a...
Khan Academy
Khan Academy: Features of Quadratic Functions: Strategy
Identify the form of a quadratic function that immediately reveals a given feature of that function. Features in question are the y-intercept of the graph, the zeroes ("roots") of the function, and the vertex of the parabola. Students...
Khan Academy
Khan Academy: Features of Quadratic Functions: Strategy
Identify the form of a quadratic function that immediately reveals a given feature of that function. Features in question are the y-intercept of the graph, the zeroes ('roots') of the function, and the vertex of the parabola.
Texas Instruments
Texas Instruments: Explore Parallel and Perpendicular Lines
Students can use a graphing calculator to explore graphs of parallel and perpendicular lines. Students will find that parallel lines have the same slope and different y-intercepts and that the slopes of two perpendicular lines are...
Texas Instruments
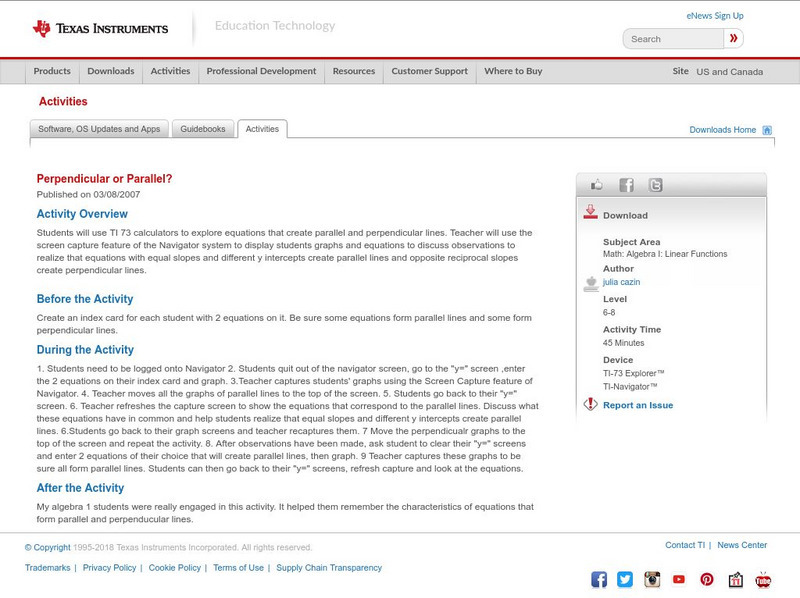
Texas Instruments: Perpendicular or Parallel?
Students can use TI 73 calculators to explore equations that create parallel and perpendicular lines. Teacher will use the screen capture feature of the Navigator system to display students graphs and equations to discuss observations to...
Texas Instruments
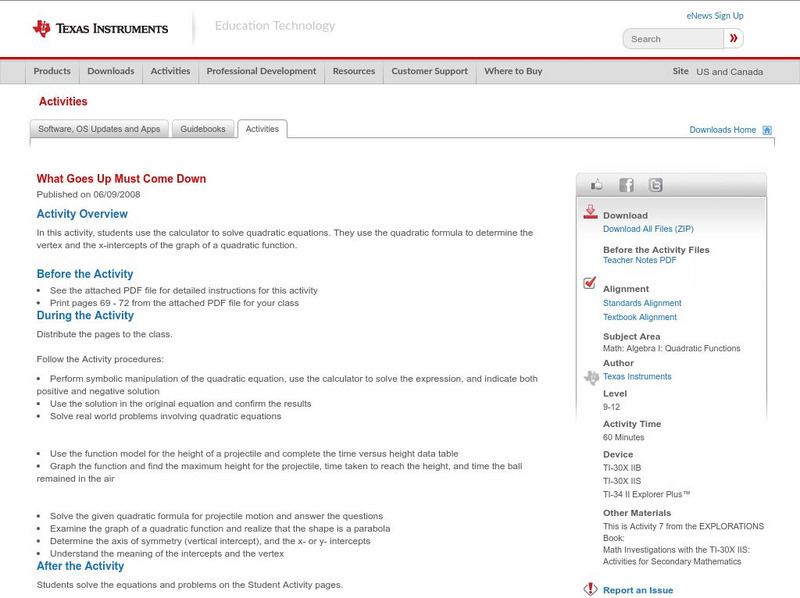
Texas Instruments: What Goes Up Must Come Down
In this activity, students use the calculator to solve quadratic equations. They use the quadratic formula to determine the vertex and the x-intercepts of the graph of a quadratic function.
Council for Economic Education
Econ Ed Link: Taxes and Income
Use this interactive graph to gain an understanding of how taxes increase as your income goes up. The y-intercept line shows the base tax amount for no income.
PBS
Pbs: Modeling the Linear Relationship Between Fahrenheit and Celsius
Explore the relationship between degrees Fahrenheit and degrees Celsius. This video focuses on developing an expression to model the relationship between the temperature scales using a line graph to calculate slope and the y intercept.
Khan Academy
Khan: Lesson 5: Relationships Among Linear Equations, Lines in Coordinate Plane
This lesson focuses on the relationship between algebraic, graphical, and contextual expressions of linear equations.
