NASA
Nasa: Precipitation Towers: Modeling Weather Data
This lesson uses stacking cubes as a way to graph precipitation data, comparing the precipitation averages and seasonal patterns for several locations. Variations on the lesson can accommodate various ages and ability levels. Students...
NASA
Nasa: Using Radiosonde Data From a Weather Balloon Launch
This lesson plan allows young scholars to learn about the layers of the atmosphere and to learn how to graph real atmospheric data.
Center for Innovation in Engineering and Science Education, Stevens Institute of Technology
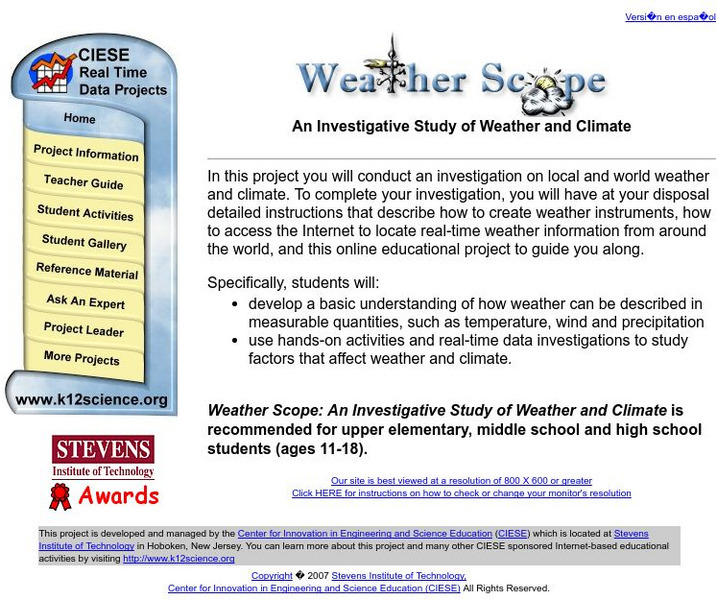
Ciese Real Time Data Projects: Weather Scope: A Study of Weather and Climate
Use real-time data to study factors that affect weather and climate, create weather instruments, and share data with students around the world.
Illustrative Mathematics
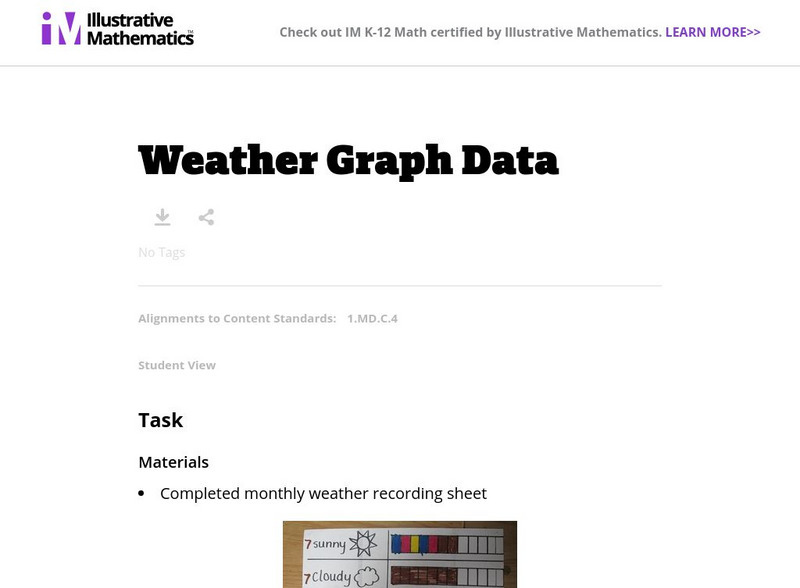
Illustrative Mathematics: Weather Graph Data
The purpose of this task is for students to represent and interpret weather data, as well as answer questions about the data they have recorded. Student worksheets and recording sheet are included.
University Corporation for Atmospheric Research
Ucar: Weather and Climate Data Exploration
Students explore the relationship between weather and climate by graphing weather temperature data and comparing with climate averages.
University Corporation for Atmospheric Research
Ucar: Get the Picture Severe Weather
Students review graphs and charts of severe weather data then answer "True and False" questions about the content conveyed.
Better Lesson
Better Lesson: Comparing the Weather
In order to meet Common Core standards, 2nd graders need to be able to interpret data to solve problems. This lesson provides practice in this area. Included in this lesson are a printable temperature chart and a video of second graders...
University Corporation for Atmospheric Research
Ucar: Project Sky Math
Teachers will be interested to explore the SkyMath module, and the 16 classroom activities at this site. In this program, students will collect and record real-time weather data to analyze. Data analysis, graphing, number relationship,...
University Corporation for Atmospheric Research
Ucar: Differences Between Climate and Weather
In this activity, students collect weather data over several days or weeks, graph temperature data, and compare the temperature data collected with averaged climate data where they live.
Alabama Learning Exchange
Alex: What's the Weather Like?
Students will use the Internet to compare the weather forecast for their city with other cities throughout the United States each week during this unit. Data will be charted for a five-day period then analyzed and discussed.
Better Lesson
Better Lesson: Graphing January's Weather
First graders graph the weather in Vermont for the month of January.
Science Education Resource Center at Carleton College
Serc: Do You Really Want to Visit the Arctic?
This jigsaw activity is designed for students to become familiar with several datasets of Arctic weather data, collected in Eureka on Ellesmere Island. Students join a role-playing activity to read and interpret graphs while considering...
Science Education Resource Center at Carleton College
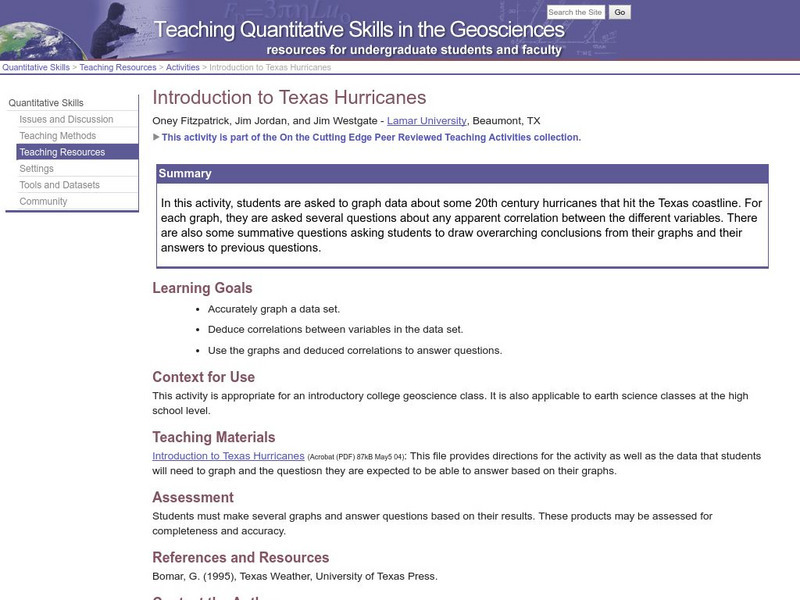
Serc: Introduction to Texas Hurricanes
In this activity, students are asked to graph data about some 20th century hurricanes that hit the Texas coastline. For each graph, they are asked several questions about any apparent correlation between the different variables. Students...
Science Education Resource Center at Carleton College
Serc: Measuring and Comparing Temperatures
Using thermometers, students will compare differences in the temperature of various materials and locations. They will record and chart the data that was collected and present the graphs to their classmates.


