Curated OER
Cold, Clouds, and Snowflakes
Students explore satellite data and graphing. In this weather data analysis math and science lesson, students analyze NASA satellite data to draw conclusions about geographical areas where precipitation might have happened. Students...
Curated OER
Weather
Learners create a spreadsheet and chart using data collected. In this weather lesson, students select five cities from their state, including the city they live in. Learners take daily temperature readings from all five...
Curated OER
Graphing Changes in Weather
Students graph current temperature and weather conditions for three days. In this weather lesson, students go to the Weather Channel's website and look up weather for their zip code then graph the conditions and record the current...
Curated OER
Excel temperature Graphs
Students gather data about the weather in Nome, Alaska. In this Nome Temperature lesson, students create an excel graph to explore the weather trends in Nome. Students will find the average weather and add a trend line to their graph.
Curated OER
Countdown to Disaster
Students discover the potential dangers of weather in their hometown. In this environmental lesson, students research Hurricane Hugo and the devastation it caused South Carolina in 1989. Students record weather data from...
Curated OER
MAISA and the REMC Association of Michigan
Students complete online research to study geography's impact on weather. In this geography and weather lesson, students research weather in their city for ten days using an online website. Students bookmark the site, enter data into a...
Curated OER
Observing Weather
Students investigate the weather by reading children stories. In this weather observation lesson, students read Cloudy With a Chance of Meatballs and several other stories about weather before they create a KWL chart....
Curated OER
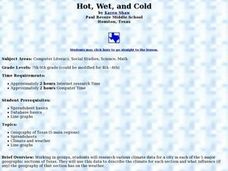
Hot, Wet, and Cold
Students research climate data for a city in each of the 5 major geographic sections of Texas. They use data to describe the climate and what influence the geography of that section has on the weather.
Curated OER
Phenomenal Weather-Related Statistics
Eighth graders research, collect and interpret data about weather statistics. They record that data on spreadsheets. they create Powerpoint presentations on their individual or group research.
Curated OER
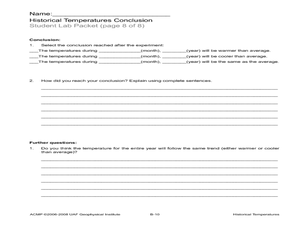
Historical Temperatures
Young scholars research historical regional temperatures for their current season. In this historical weather lesson, students conduct weather station and Internet research to learn about historical regional temperatures. Young scholars...
Curated OER
Basic Excel
Students explore basic Excel spreadsheets. In this spreadsheet lesson plan, students enter Alaska weather information and perform calculations. Students title the columns on the spreadsheet and format the cells. ...
Curated OER
Temperature High and Lows
Students gather high and low temperature readings through email. In this temperature graphing lesson, students use a spreadsheet to input data for a graph. students interpret the graphs to compare and contrast the data from different...
Curated OER
What's Up With the Water Cycle?
Students explore the water cycle. Students identify the stages in a water cycle and create a PowerPoint presentation based on their knowledge.
Curated OER
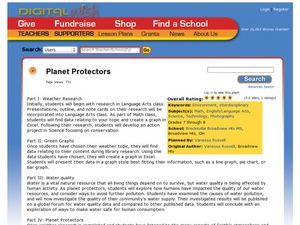
Planet Protectors
Students explore ways to protect the earth. In this environmental issues and technology instructional activity, students investigate the water quality in their community and compare their findings to the water quality in other...


