Curated OER
Student News And Weather Channel
Fabulous! Your 5th graders should love this project. As an ongoing lesson throughout the year students use temperature probes to record outside temperature and then document their data using spreadsheets. They use their weather data and...
Curated OER
Cold, Clouds, and Snowflakes
Students explore satellite data and graphing. In this weather data analysis math and science lesson, students analyze NASA satellite data to draw conclusions about geographical areas where precipitation might have happened. Students...
Curated OER
Graphing and Analyzing Biome Data
Students explore biome data. In this world geography and weather data analysis lesson, students record data about weather conditions in North Carolina, Las Vegas, and Brazil. Students convert Fahrenheit degrees to Celsius degrees and use...
Curated OER
Weather
Students create a spreadsheet and chart using data collected. In this weather instructional activity, students select five cities from their state, including the city they live in. Students take daily temperature readings...
Curated OER
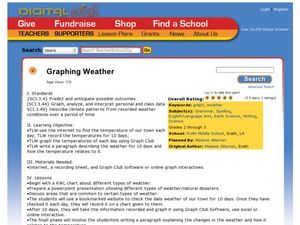
Graphing Weather
Students make a graph. In this weather lesson, students fill in a KWL chart about different types of weather. Students watch a PowerPoint presentation about weather and natural disasters and where these types of weather are common....
Curated OER
Graphing Climate Information
Seventh graders plot the data for the average monthly precipitation for three cities. They make a graph using a spreadsheet.
Curated OER
Technology Integration Project Weather Unit Plan
Learners use a variety of technology-assisted weather observation tools to observe and record local weather. They identify, measure and record weather conditions, summarize types of clouds and make graphs of their observations. Students...
Curated OER
The Mitten
Explore the Ukraine through a reading of The Mitten. Readers will determine the sequence of events, cause and effect, make predictions, and find the main idea of the story. They also use math skills to make charts and graphs. Finally,...
Curated OER
Graphing Changes in Weather
Students graph current temperature and weather conditions for three days. In this weather lesson plan, students go to the Weather Channel's website and look up weather for their zip code then graph the conditions and record the...
Kenan Fellows
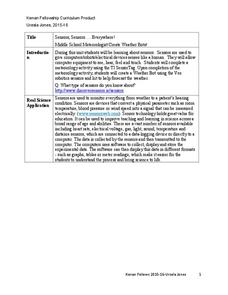
Sensors, Sensors…..Everywhere! Middle School Meteorologist Create Weather Bots!
My forecast is that you'll want to use the resource. Pupils design and create a weather bot as part of a project-based unit. These bots should be able to measure temperature, humidity, barometric pressure, wind speed and direction, and...
Curated OER
Countdown to Disaster
Students discover the potential dangers of weather in their hometown. In this environmental lesson plan, students research Hurricane Hugo and the devastation it caused South Carolina in 1989. Students record weather data from...
Curated OER
MAISA and the REMC Association of Michigan
Students complete online research to study geography's impact on weather. In this geography and weather lesson, students research weather in their city for ten days using an online website. Students bookmark the site, enter data into a...
Curated OER
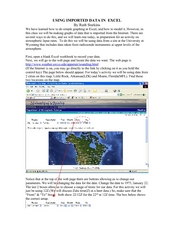
Using Imported Data in Excel
Young scholars import atmospheric data from the internet. In this earth science lesson, students graph the data they collected. They complete the worksheet after the activity.
Curated OER
Observing Weather
Students investigate the weather by reading children stories. In this weather observation lesson, students read Cloudy With a Chance of Meatballs and several other stories about weather before they create a KWL chart....
Teach Engineering
Pointing at Maximum Power for PV
Following detailed directions, teams collect the voltage and current outputs of a photovoltaic cell by adjusting the resistance. Using the collected data, they determine the highest power output. Implications for weather and a large...
Teach Engineering
Maximum Power Point
Investigate the maximum power output of a photovoltaic panel with a lesson that introduces the class to the maximum power point. Individuals learn how to determine the maximum power point of a solar panel by using Ohm's law and the power...
Curated OER
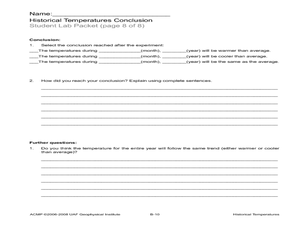
Historical Temperatures
Students research historical regional temperatures for their current season. In this historical weather lesson, students conduct weather station and Internet research to learn about historical regional temperatures. Students collect and...
Curated OER
Basic Excel
Learners explore basic Excel spreadsheets. In this spreadsheet lesson plan, students enter Alaska weather information and perform calculations. Learners title the columns on the spreadsheet and format the cells. ...
Curated OER
Keep It Cool
Students complete a science experiment to study insulation, heat transfer, and permafrost. In this permafrost study lesson, students design and test a soda insulator. Students graph their class data and discuss the results. Students...
Curated OER
Spreadsheets in Science
Fourth graders create spreadsheets, explore patterns and make predictions based on the information. They select the appropriate graph to display the spreadsheet data. They search and sort prepared data bases to gain knowledge for...
Curated OER
What's Up With the Water Cycle?
Students explore the water cycle. Students identify the stages in a water cycle and create a PowerPoint presentation based on their knowledge.
Curated OER
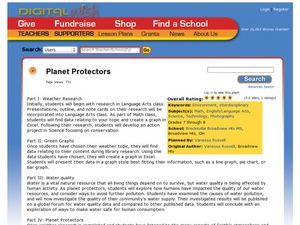
Planet Protectors
Students explore ways to protect the earth. In this environmental issues and technology instructional activity, students investigate the water quality in their community and compare their findings to the water quality in other...


