Curated OER
Weather Observation Journal
Students record weather for a period of one month. In this weather lesson, students observe weather for one month on a large pictograph. Students record clouds, wind, temperature and any other weather conditions they observe. Students...
Curated OER
Temperature High and Lows
Students gather high and low temperature readings through email. In this temperature graphing lesson, students use a spreadsheet to input data for a graph. students interpret the graphs to compare and contrast the data from different...
Curated OER
Our City's Temperature
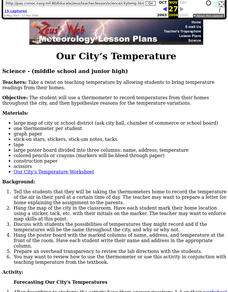
Middle schoolers use a thermometer to record temperatures from their homes throughout the city, and then hypothesize reasons for the temperature variations. They use a weather graph worksheet that's imbedded in this lesson to orgainize...
Curated OER
Using Vegetation, Precipitation, and Surface Temperature to Study Climate Zones
Students begin their examination of the climate zones found around the world. Using a software program, they identify the relationship between the vegetation, climate and temperatures of the different zones. They also plot coordinates...
Chicago Botanic Garden
Historical Climate Cycles
What better way to make predictions about future weather and climate patterns than with actual climate data from the past? Young climatologists analyze data from 400,000 to 10,000 years ago to determine if climate has changed over...
Curated OER
Introducing Temperature Measurement
Students explore temperature and use Celcius thermometers to measure and graph the temperature in the classroom daily. They estimate what they think the temperature might be and then find the actual temperature in the room.
Curated OER
Graphing the Facts
Students investigate the correlation between our planet's weather and solar activity. They analyze and discuss data regarding the solar activity cycle, graph annual precipitation and temperature averages over a period of 100 years, and...
Curated OER
Newport Weather Project
Learners study weather and climate patterns using computer and Internet resources. They collect temperature information and share it with other classes via e-mail using graphs
Curated OER
Integers in the Weather
Middle schoolers engage in a clever lesson that combines meteorology with mathematical thinking. They use integers in relation to high and low temperatures that they record. They use a spreadsheet of weather data, a computer, and gain...
Curated OER
The Weather in South America
Students conduct Internet research on weather and weather conditions in South America. They read a weather report in Spanish, and answer worksheet questions on South American countries and their weather conditions.
Curated OER
Weather/ Seasons Chart
After reviewing weather expressions with your Spanish scholars, have them do some research: what is the weather like in different parts of the world? They can choose up to four different cities to compare with the local weather of their...
Curated OER
Comparing Temperatures and Latitudes
Eighth graders collect weather data from a variety of cities at the same latitudes, but on different continents. They organize data using spreadsheet program, generate graphs, and incorporate into a word processing document. Students...
Curated OER
Temperature and Tracking Weather
Fourth graders discuss, describe and track weather by utilizing a variety of measurable quantities as temperature, wind speed, wind direction, cloud conditions and precipitation. They assess, through experiments and practicing, how to...
Curated OER
The Air Up There
In this data collection and analysis lesson, students observe and graph the weather conditions during one school week, then calculate the average weather temperature. Extensions are included.
Curated OER
Graphing and Analyzing Biome Data
Students explore biome data. In this world geography and weather data analysis instructional activity, students record data about weather conditions in North Carolina, Las Vegas, and Brazil. Students convert Fahrenheit degrees to Celsius...
Curated OER
Creating Climographs
Students use satellite data to compare precipitation and surface temperatures on different islands. In this satellite lesson plan students create graphs and explain the differences between weather and climate.
Curated OER
Is Grandpa Right, Were Winters Colder When He Was a Boy?
Middle schoolers compare current weather data to historic data to see if there is a temperature change. In this weather activity students complete a lab activity and determine average changes in temperature, precipitation and cloud...
Curated OER
The Fabled Maine Winter
Students graph and analyze scientific data. In this research lesson students use the Internet to obtain data then draw conclusions about what they found.
Curated OER
Comparing the Effects of El Nino and La Nina
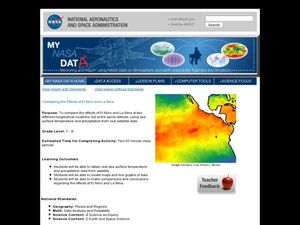
Students examine the differences between an El Nino and La Nina year. In this investigative lesson plan students create maps and graphs of the data they obtained.
Curated OER
Feeling the Heat
Pupils record temperatures at different locations around campus. They examine the results and draw conclusions about how materials and colors affect the amount of heat produced. They also analyze Los Angeles' temperature records over a...
Curated OER
Radiation Comparison Before and After 9-11
Using the NASA website, class members try to determine if changes could be detected in cloud cover, temperature, and/or radiation measurements due to the lack of contrails that resulted from the halt in air traffic after the attacks...
Curated OER
Graphing Temperatures
Students identify current temperatures for different regions of the United States. Using current information, they develop hypothesis for the temperature in the same region tomorrow. They use the Weather Channel website to find actual...
Curated OER
Trends of Snow Cover and Temperature in Alaska
Students gather historical snow cover and temperature data from the MY NASA DATA Web site. They compare this data to data gathered using ground measurements from the ALISON Web site for Shageluk Lake. They graph both sets of data and...
Curated OER
Shedding Light on the Weather with Relative Humidity
Learners study weather using a graphing calculator in this lesson. They collect data for temperature and relative humidity for every hour over a day from the newspaper, then place the data in their handheld calculator and examine it for...


