Khan Academy
Khan Academy: What Are Position vs. Time Graphs?
What can you learn from graphs that relate position and time and how are they useful? Article relates what the verticle axis, slope, and curvature represents on a position graph and provides examples.
Other
The University of Edinburgh: Discrete Mathematics Graphs
This article is an in-depth look at graphs. Topics covered are graph models, terminology, representations of graphs, graph isomorphism, connectivity, Euler and Hamiltonian Paths, and more. Examples and explanations are included.
Shodor Education Foundation
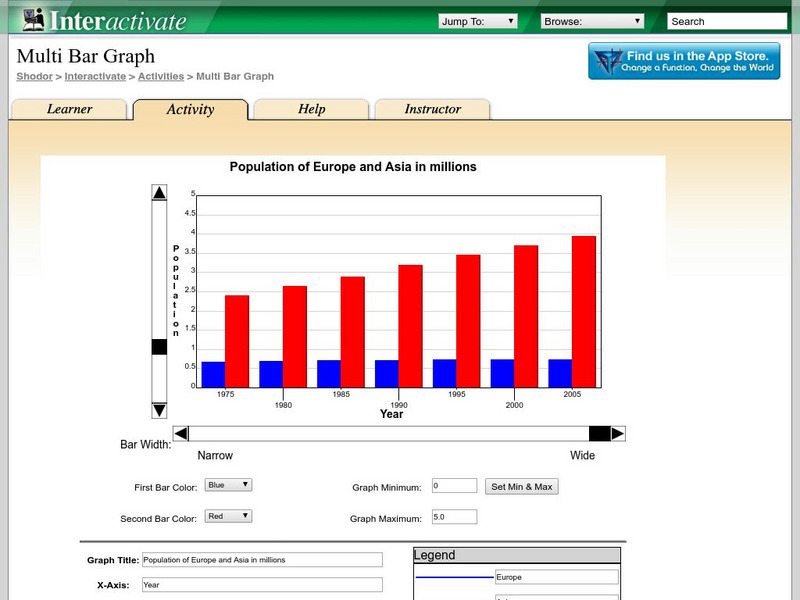
Shodor Interactivate: Multi Bar Graph
The interactive learning activity allows students to manipulate a double bar graph. Teacher resources are included.
Khan Academy
Khan Academy: What Are Velocity vs. Time Graphs?
Graphs and examples help explain what the vertical axis, slope, and area represent on a velocity-time graph.
PBS
Pbs Learning Media: What's Up With the Weather: Graphs
Examine this graph from FRONTLINE/NOVA: "What's Up with the Weather?" Web site to see dramatic increases in three greenhouse gases over the last two hundred years.
Texas Education Agency
Texas Gateway: Solving Systems of Equations With Graphs
Given verbal and/or algebraic descriptions of situations involving systems of linear equations, the student will solve the system of equations using graphs. Incorporates GeoGebra applets.
Texas Education Agency
Texas Gateway:analyzing Effects of the Changes in M and B on the Graph of Y=mx+b
Given algebraic, graphical, or verbal representations of linear functions, the studnet will determine the effects on the graph of the parent function f(x) = x.
PBS
Pbs Learning Media: Global Warming: Graphs Tell the Story
Examine these graphs from the NOVA/ FRONTLINE Web site to see dramatic increases in the temperature of Earth's surface and greenhouse gases in the atmosphere.
Wolfram Research
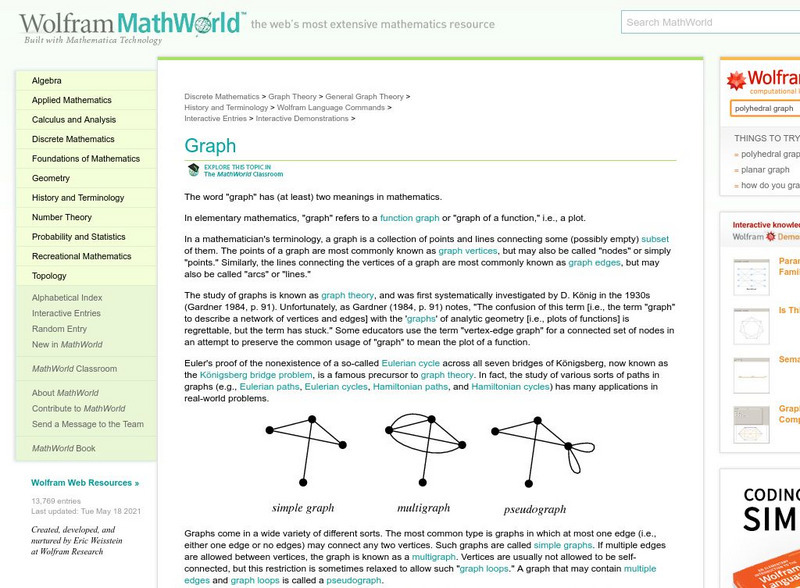
Wolfram Math World: Graphs
MathWorld.com shows many types of discrete math graphs and provides links to related topics.
University of North Carolina
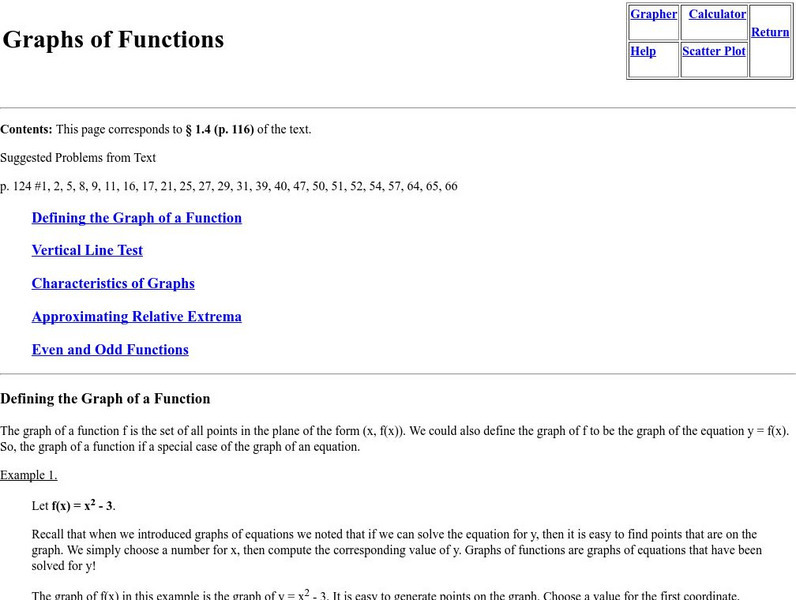
University of North Carolina Wilmington: Graphs of Functions
Defining the graph of a function, vertical line test, characteristics of graphs, approximating relative extrema, and even and odd functions are covered with examples that include charts and graphs.
PBS
Pbs: Interpreting Stories and Graphs
This interactive exercise focuses on how line graphs can be used to represent mathematical data and provides an opportunity to translate actions from a story into graph form, then to write your own story to coincide with a line graph.
Mathigon
Mathigon: Graphs and Networks: The Bridges of Konigsberg
This lesson focuses on developing a way to cross all 7 Bridges of Konigsberg without crossing any of them more than once. Euler discovered it was impossible, but he developed the idea of using graph theory to determine if it would be...
PBS
Pbs: Manipulating Graphs
Watch how a graph is altered when key elements of the equation change. This lesson focuses on how to manipulate the equation of a line in slope intercept form to match the graphs provided deepening the understanding of both the slope and...
Math Planet
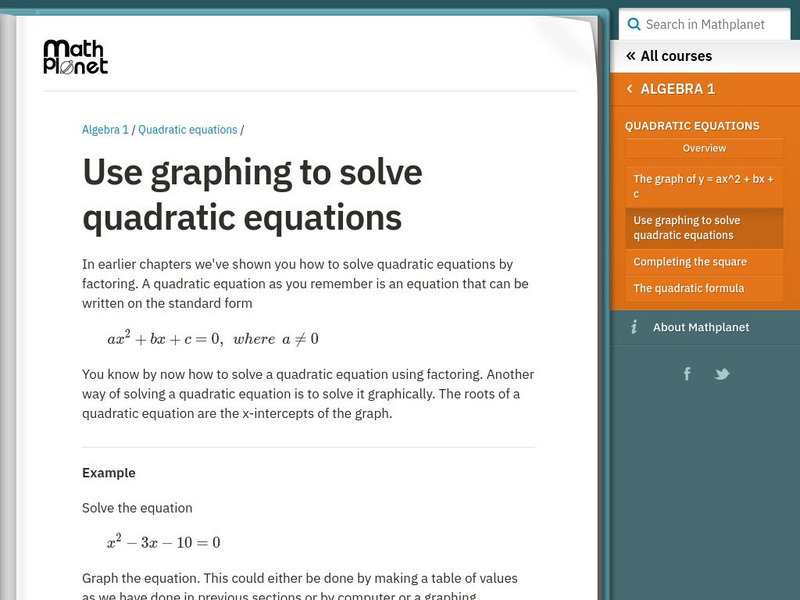
Math Planet: Use Graphing to Solve Quadratic Equations
A quadratic equation is an equation that can be written on the standard form ax^2 + bx + c = 0, where a is not = 0. One way of solving a quadratic equation is by factoring. Another way of solving a quadratic equation is to solve it...
Khan Academy
Khan: Lsn 8: Interpreting Relationships in Scatterplots/graphs/tables/equations
This lesson focuses on Interpreting and analyzing linear, quadratic, and exponential models and graphs. Students will use best fit lines to interpret contexts, distinguish whether contexts are linear or exponential functions, use the...
Purple Math
Purplemath: Trigonometric Functions and Their Graphs
Explains the horizontal forms of trigonometric graphs by showing how they relate to the circular graphs.
University of Saskatchewan (Canada)
University of Saskatchewan: Graphing Rational Functions
Offers a straightforward introduction to graphing rational functions. Includes an example.
Illustrative Mathematics
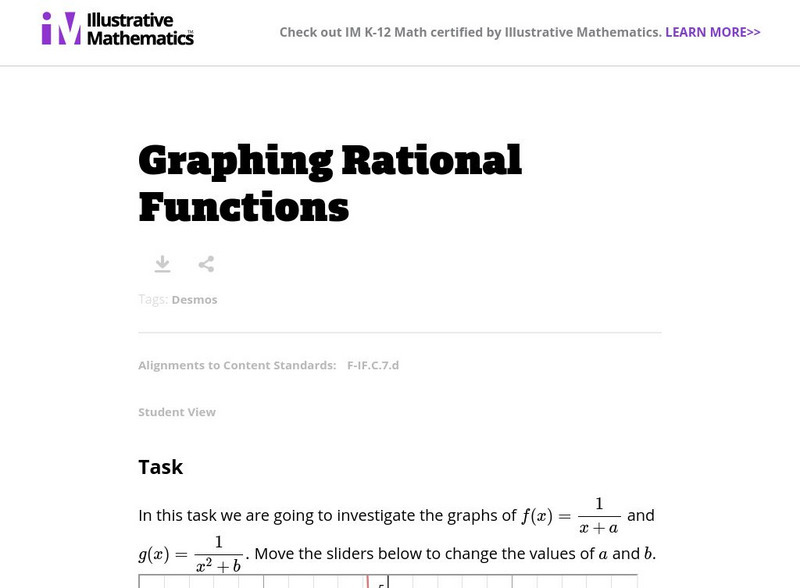
Illustrative Mathematics: F if Graphing Rational Functions
In this task, learners interact with a Desmos app by moving sliders and making observations about features of the graphs and the structures of the expressions of the functions. Aligns with F-IF.C.7.d.
Paul Dawkins
Paul's Online Notes: Algebra: Graphing Functions
Detailed math tutorial features notes and examples that take a look at graphing functions including several examples of graphing piecewise functions.
Texas Education Agency
Texas Gateway: Determining Parent Functions (Verbal/graph)
Given a graph or verbal description of a function, the student will determine whether the parent function is quadratic or linear.
CK-12 Foundation
Ck 12: Analysis of Logarithmic Graphs: Graphs of Logarithmic Functions
[Free Registration/Login may be required to access all resource tools.] Graphing logarithmic functions using transformations. Identifying log functions as the inverses of exponential functions. Students examine guided notes, review...
CK-12 Foundation
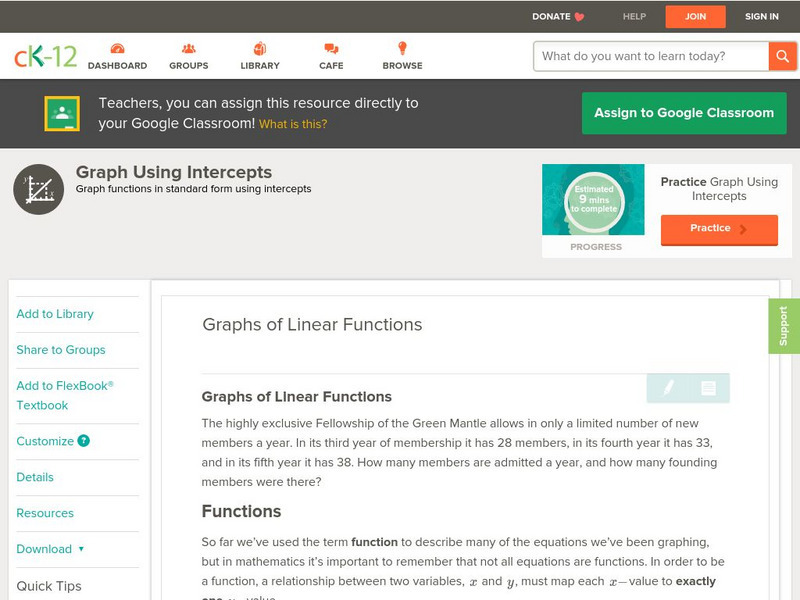
Ck 12: Algebra: Graph Using Intercepts: Graphs of Linear Functions
[Free Registration/Login may be required to access all resource tools.] In this tutorial, students learn to write and evaluate functions and determine if a graph represents a function. They examine guided notes, review guided practice,...
Math Is Fun
Math Is Fun: Algebra: Graphing Quadratic Equations
Explains how to graph quadratic equations and how to find the quadratic equation when given just the graph. Includes ten practice questions.
CK-12 Foundation
Ck 12: Algebra: Graphs of Exponential Functions
[Free Registration/Login may be required to access all resource tools.] Graphing functions with the input variable in the exponent (exponential functions) using transformations and technology. Students examine guided notes, review guided...
Other popular searches
- Charts and Graphs
- Bar Graphs
- Line Graphs
- Double Bar Graph
- Circle Graphs
- Pie Charts and Graphs
- Picture Graphs
- Coordinate Graphs
- Skittles Bar Graph
- Reading Charts and Graphs
- Blank Coordinate Graphs
- Percent Circle Graph


