Mt. San Antonio Collage
Test 2: Rationals, Exponentials, and Logarithms
Running out of logarithm questions in class? The nicely organized two-page worksheet provides practice in rational, logarithmic, and exponential functions. All the topics include graphing, solving, and finding domain and range.
Curated OER
Parent Functions Review Sheet
No laundry or cooking dinner here: these parent functions are all about math. Every graph you could think of from basic linear functions to the hyperbolic arccotangent function are included. With 40 parent functions, the worksheet can be...
CPO Science
Physics Skill and Practice Worksheets
Stop wasting energy searching for physics resources, this comprehensive collection of worksheets has you covered. Starting with introductions to the scientific method, dimensional analysis, and graphing data, these skills practice...
Ontrack Media
Chart of Parent Functions
The characteristics of parent function vary from graph to graph. Let learners decipher the graph, table of values, equations, and any characteristics of those function families to use as a guide. The nicely organized page displays the...
National Security Agency
Are You Ready to Call the Guinness Book of Records?
Learners design questions that can be answered by collecting data. In this line-plot activity, pupils collect data and graph on a line plot on world records. An abundant supply of teacher support is provided in this resource.
Curated OER
Scatter-Brained
Seventh graders graph ordered pairs on a coordinate plane. They create a scatterplot. Additionally, they determine the line of best fit and investigate the slope of the line. Multiple resources are provided. An excellent resource!
Curated OER
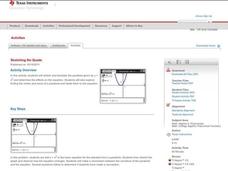
Stretching the Quads
Scholars investigate transforming parabolas. In this transforming parabolas lesson, they take the parent graph y=x^2 and transform it by shifting left, right, up, and down and shrinking and stretching. The class finds maximums,...
Curated OER
Energy Audit
Young scholars collect data about energy usage and use mathematical calculations to analyze their data. In this energy conservation and statistics math lesson, students survey their homes to complete an energy usage worksheet. Young...
Curated OER
Trigonometry Review Sheet
Get the trig facts fast, and use the review sheet as a guide in the classroom. The worksheet also includes a document version if any changes are needed to the problems. The information includes a small degree/radian chart, a graph of all...
Curated OER
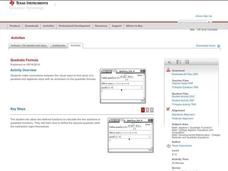
Quadratic Formula
Mathematicians determine the solutions of a quadratic function by looking at a graph. They use the quadratic formula to solve quadratic functions on their Ti-Nspire.
Curated OER
Graphing Functions With 2 Points and From a Graph
Young scholars plot points on a coordinate plane. They describe, in words, methods for finding the slope of a line. After given a worksheet, students read instructions, draw a Cartesian plane, plot ordered pairs, and graph lines. ...
Curated OER
Graphing Linear Equations Using Data Tables
Pupils review the Cartesian plane and the process of plotting points. In groups, students create tables, identify the slope and y-intercept, and graph the equation. Afterward, pupils perform the same process, only, individually. As a...
Curated OER
Graph Lab
Seventh graders explore bar graphs and pie charts. Given a pack of M&Ms, 7th graders explore the colors, sort the data in a frequency chart and then construct bar graphs and pie charts to categorize the M&Ms by color. Students...
Curated OER
Favorite Fruit Graph
In this graphing worksheet, students answer a set of questions using a graph showing favorite fruits.
Curated OER
Favorite Vehicles Graph
In this graphing worksheet, learners answer 6 simple questions using a graph showing "kids favorite vehicles."
Curated OER
Graphing Inequalities
Students graph inequalities on a number line and discuss how to solve for one variable. The teacher models examples as students take notes. In groups, students participate in an activity to demonstrate inequalities on a number line. ...
Curated OER
Favorite Animals Graph
In this graphing instructional activity, students interpret a graph of favorite farm animals and answer 6 related questions.
Curated OER
How Many More on a Graph?
First graders identify a number that is one more or one less than a number up to one hundred and identify a mystery number. They also create a class graph that illustrates how many children are in each family, and answer questions about...
Curated OER
Graphs
In this graphing worksheet, 6th graders name the place that is at the coordinates given to them of this graph of the city. Students complete 8 problems.
Curated OER
Independent Practice 2: Graphing Lines by Graphing Two Points
In this graphing lines worksheet, students solve linear equations and then graph the points on the line. This one-page worksheet contains six problems with a coordinate plane provided for each one.
Curated OER
Graphing Quadratic Functions
In this graphing quadratic equations worksheet, students graph 8 quadratic functions. Coordinate grids are included on the worksheet.
Curated OER
Learning To Read Graphs
In this graph reading learning exercise, students write how many kids like various drinks shown in a graph.
Curated OER
Reading Graphs
In this reading graphs worksheet, students interpret a graph showing numbers of colored shapes and color shapes to match the graph.
Curated OER
Reading Graphs
In this reading graphs worksheet, students interpret a simple graph, drawing correct numbers of each shape shown in the graph.
Other popular searches
- Charts and Graphs
- Bar Graphs
- Line Graphs
- Double Bar Graph
- Circle Graphs
- Pie Charts and Graphs
- Picture Graphs
- Coordinate Graphs
- Skittles Bar Graph
- Reading Charts and Graphs
- Blank Coordinate Graphs
- Percent Circle Graph


