Centers for Disease Control and Prevention
Major Disparities in Adult Cigarette Smoking Exist Among and Within Racial and Ethnic Groups
Data indicates that some racial groups smoke more than others, and that with that racial group, there are smaller groups whose smoking habits vary as well. Secondary learners read a graph that details the differences between the Asian...
PBS
Pbs Learning Media: What's Up With the Weather: Graphs
Examine this graph from FRONTLINE/NOVA: "What's Up with the Weather?" Web site to see dramatic increases in three greenhouse gases over the last two hundred years.
PBS
Pbs Learning Media: Global Warming: Graphs Tell the Story
Examine these graphs from the NOVA/ FRONTLINE Web site to see dramatic increases in the temperature of Earth's surface and greenhouse gases in the atmosphere.
Varsity Tutors
Varsity Tutors: Hotmath: Algebra Review: Graphing Linear Inequalities 2 Variable
Find a quick, concise explanation of how to graph linear two variable inequalities. An example is given and clearly explained.
The Franklin Institute
Frankin Institute Online: Group Graphing
This site from The Franklin Institute explores how to make a simple graph using a spreadsheet to portray survey data. It also gives a set of interesting sports-related web sites so that students can get statistical inforamtion.
Richland Community College
Richland Com. College: Graphing Systems of Inequalities
Thyis site offers problem solving systems and graphing systems of inequalities. Illustrations included.
University of Guelph
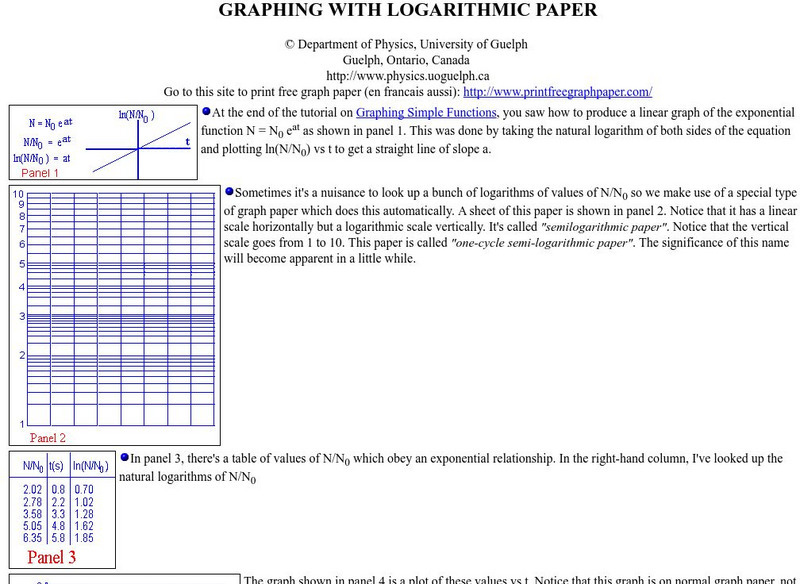
University of Guelph: Graphing With Logarithmic Paper
Good tutorial explaining how to produce a graph on logarithmic paper.
National Council of Teachers of Mathematics
The Math Forum: Lines and Slope: Chameleon Graphing
Join Joan the chameleon in an exploration of lines and slope. You'll be drawing lines, calculating slope, using equations and more!
Rice University
Rice University: Cynthia Lanius: Let's Graph
An introduction to bar graphs, both vertical and horizontal in nature. The interactive aspect of this site allows students to change the values of the data - their favorite cafeteria foods - and then see how the graph is changed.
Math2
Math2.org: Algebraic and Conic Section Graphs
THis resource provides examples and information about Algebraic graphing.
Other
The Topic: Charts and Graphs
Brief descriptions of charts and graphs, followed by links to larger sites on the same subject.
Varsity Tutors
Varsity Tutors: Hotmath: Algebra Review: Graph Theory
Find a quick, concise explanation of graph theory. Examples are given and clearly explained.
Discovery Education
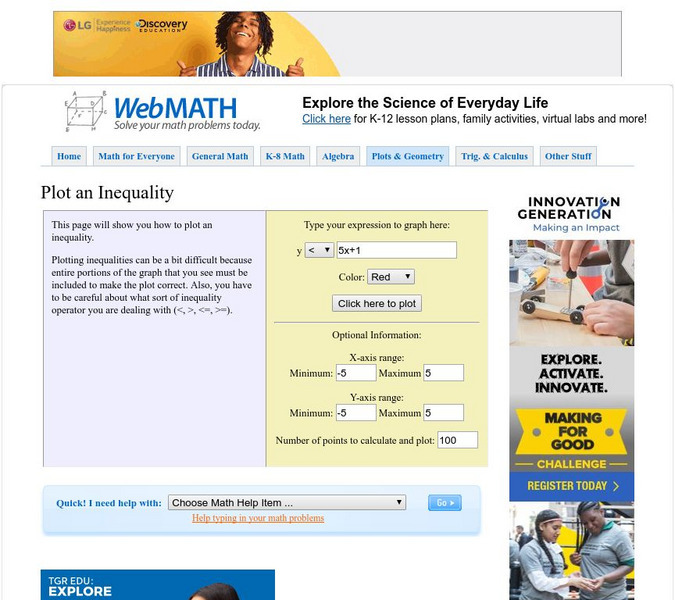
Discovery Education: Web Math: Plot/graph an Inequality
This site provides a step-by-step process to graph an inequality. Simply type in your expression, and the website will graph the expression as well as explain how and why it did what it did.
Wolfram Research
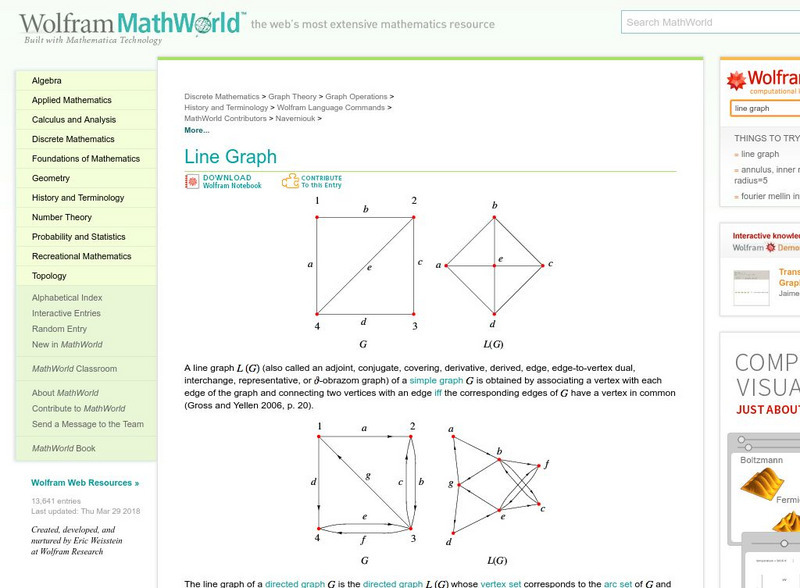
Wolfram Math World: Line Graph
Definition of a line graph with a variety of examples. Includes maps, charts, and detailed explanations for understanding.
Analyze Math
Analyze Math: Identify Graphs of Functions
Learners examine graphs of algebraic functions. Four graphs are given and students identify the corresponding algebraic function. The activity includes examples with detailed solutions.
University of Minnesota
University of Minnesota: Exponential Graph
The University of Minnesota offers an animated calculus site showing how the graph changes as the base changes.
Anne Arundel Community College
Anne Arundel Community College: Math 131: Basic Graphs and Properties
The tutorial examines basic exponential graphs and their properties. Students learn about the mathematics concepts through examples with detailed solutions.
Anne Arundel Community College
Anne Arundel Community College: Math 131: More Graphs
The tutorial examines exponential graphs and their properties. Students learn about the mathematics concepts through examples with detailed solutions.
J Coffman
Joseph Coffman's Lecture Notes: Absolute Value Functions and Graphs
Students learn about absolute value functions. The learning exercise consists of examples and an assessment on how to graph absolute value functions.
Incorporated Research Institutions for Seismology
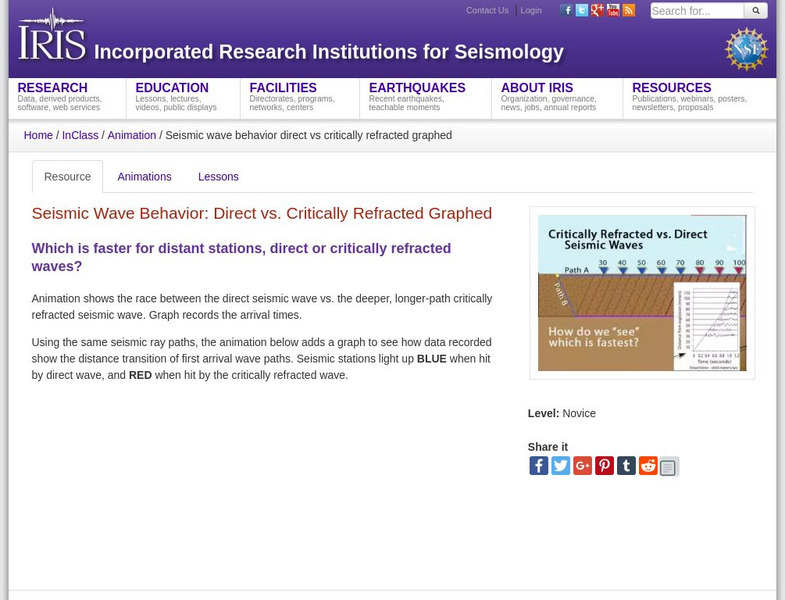
Iris: Seismic Wave Behavior: Direct vs. Critically Refracted Graphed
Examine the behavior of seismic waves. This graph illustrates direct and critically refracted waves.
US Census Bureau
Us Census Bureau: Population Pyramid Graph for Canada
Graphs showing the population pyramids of Canada from the year 2018. Shows a comparison of males versus females.
University of Cambridge
University of Cambridge: Nrich: Graphing Number Patterns
On this one page website sharpen your logic, graphing and pattern recognition skills while working on this challenge. The solution is available to double check your solution.
Varsity Tutors
Varsity Tutors: Hotmath: Algebra Review: Graph Theory Degree of a Vertex
Find a quick, concise explanation of how to find the degree of a vertex in graph theory. An example is given and clearly explained.
Purple Math
Purplemath: Graphing Linear Inequalities Lesson: Y > Mx + B, Etc.
Demonstrates, step-by-step and with illustrations, how to graph linear (two-variable) inequalities.
Other popular searches
- Charts and Graphs
- Bar Graphs
- Line Graphs
- Double Bar Graph
- Circle Graphs
- Pie Charts and Graphs
- Picture Graphs
- Coordinate Graphs
- Skittles Bar Graph
- Reading Charts and Graphs
- Blank Coordinate Graphs
- Percent Circle Graph


