Curated OER
Data Analysis
In this data analysis worksheet, students solve and complete 4 different types of problems. First, they reduce the data provided to find the means, and graph the means in a line graph. Then, students graph the data from each mixture...
Curated OER
Point Graphs
Students experiment with point graphs. In this math instructional activity, students are divided into groups and perform an experiment to see how high a ball bounces, recording their results on a point graph. Students then answer...
Curated OER
Price of Apples- Linear Data
Students collect data and create a graph. In this algebra lesson, students describe functions graphically, algebraically and verbally. They identify functions as being independent and dependent using variables.
Curated OER
Data Handling
In this data handling worksheet, students explore multiple ways to represent data. They create stem and leaf plots, histograms, and bar charts. Students examine and interpret diagrams and statistics. This eleven-page...
Curated OER
A Data Processing Lesson for Statistics -- Reading a Table or Chart
Students identify the structure and key parts of tables and charts. They determine which data is meanjngful and make comparisons with the data. They describe the scope of the AIDS plague throughout the world.
Curated OER
Data Analysis
Learners double check their data collections of Top 20 singles that they've been collecting for several days. Types of data is reviewed in detail and a variety of questions are asked for retention factors of mastery. They draw a tally...
Curated OER
Skittle Graphing (Lesson Plan)
Students discuss the uses of graphs. They use color candies to count and sort before designing graphs. They label the graph papers with appropriate titles and candy colors. They complete the graph bars, and discuss the results with a...
Curated OER
Bean Growth Project Graph Worksheet
In this bean growth project graphing activity, student collect data and create a line graph. They use a different color for each line that shows the growth of each bean plant.
Curated OER
Using Data From a Graph
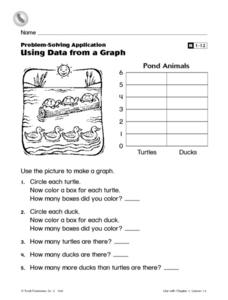
In this graphing worksheet, students create a bar graph with information from a picture of some pond animals. Students answer 5 questions about the graph.
Curated OER
Data Analysis Digital Display
Students create a survey online. In this math lesson plan, students graph survey data using flisti.com. They share and analyze their classmates' histogram.
Curated OER
Organizing and Interpreting Data
In this organizing and interpreting data worksheet, students solve and complete 10 different problems related to reading various data tables. First, they complete the 3 charts shown with the correct tally amount, frequency amount, and...
Curated OER
Which Time of Day Do You Like Best?-- Class Bar Graph
In this math worksheet, students collaborate in making a bar graph which displays their favorite time of day: art, music, gym or library. The class is surveyed and responses are plotted on this graph.
Curated OER
What Do You Like on Your Popcorn?-- Class Bar Graph
In this math learning exercise, students participate in a class bar graph activity. Students survey classmates as to their popcorn preferences: nothing, butter or salt. Results are plotted on the graph.
Curated OER
How Do You Like Your Sandwich? --class Bar Graph
In this math worksheet, students participate in a group bar graph activity. Students survey their classmates on favorite sandwich choices: peanut butter and jelly, grilled cheese or meat. Results are plotted on a bar graph.
Curated OER
Which Kind of Weather Do You Like Best? -- Class Bar Graph
In this math worksheet, students generate a class bar graph. Classmates are surveyed about favorite weather: sunny, rainy, snowy, cloudy or windy. Results are displayed on a bar graph.
Curated OER
Blank Bar Graph -interval of 5
In this blank bar graph learning exercise, learners use the grid to display data in a bar graph. The intervals labeled are counting by 5s, from 5 to 50.


