Hi, what do you want to do?
Government of Alberta
Learn Alberta: Math Interactives: Exploring Data Display and Graphs
This multimedia Learn Alberta math resource focuses on graphing data. In the video portion, students will see how math is involved in the display of merchandise in stores. The accompanying interactive component provides an exploration...
CK-12 Foundation
Ck 12: Statistics: Data Display Choices Grades 6 7
[Free Registration/Login may be required to access all resource tools.] Create surveys and display data using different types of graphs.
Texas Education Agency
Texas Gateway: Selecting and Using Representations for Collected Data
[Accessible by TX Educators. Free Registration/Login Required] Given a variety of data (including line plots, line graphs, stem and leaf plots, circle graphs, bar graphs, box and whisker plots, histograms, and Venn diagrams), the student...
National Center for Ecological Analysis and Synthesis, University of California Santa Barbara
Kids Do Ecology: Data and Science
Learn about conducting your own investigation with these tips on following the scientific method. Find out how to state hypothesis, make observations, collect and analyze data, and display data to share results and conclusions of your...
Khan Academy
Khan Academy: Comparing Data Displays
Practice interpreting and comparing dot plots, histograms, and box plots. Students receive immediate feedback and have the opportunity to try questions repeatedly, watch a video or receive hints.
McGraw Hill
Glencoe: Self Check Quizzes 1 Using Bar and Line Graphs
Use Glencoe's randomly generated self-checking quiz to test your knowledge of using bar and line graphs. Each question has a "Hint" link to help. Choose the correct answer for each problem. At the bottom of the page click the "Check It"...
American Association of Physics Teachers
Com Padre Digital Library: Open Source Physics: Data Tool Program
Use this online data analysis tool to build graphs and display results from scientific investigations. Data can be entered directly with the keyboard or imported from, and exported to spreadsheets.
E-learning for Kids
E Learning for Kids: Math: Elephant Plant: Data
Gyan's family grows flowers. Can you help him interpret displayed data about their plants?
CK-12 Foundation
Ck 12: Statistics: Line Graphs to Display Data Over Time
[Free Registration/Login may be required to access all resource tools.] Create line graphs to display how data changes over time.
Better Lesson
Better Lesson: Graph Party
First graders will be involved in creating three different types of graphs and then be asked to answer questions about each representations data set.
McGraw Hill
Glencoe: Self Check Quizzes 1 Analyzing Graphs
Use Glencoe's randomly generated self-checking quiz to test your knowledge of how to analyze graphs. Each question has a "Hint" link to help. Choose the correct answer for each problem. At the bottom of the page click the "Check It"...
CK-12 Foundation
Ck 12: Statistics: Basic Graph Types
[Free Registration/Login may be required to access all resource tools.] Organize distributions of data by using a number of different methods.
BBC
Bbc: Representing Data
This BBC Math Bite tutorial for line graphs, pictograms, and frequency polygons features an exam in which students draw and interpret statistical diagrams.
CK-12 Foundation
Ck 12: Statistics: Line Graphs Grade 7
[Free Registration/Login may be required to access all resource tools.] Make a line graph to display data over time.
CK-12 Foundation
Ck 12: Statistics: Multiple Line Graphs
[Free Registration/Login may be required to access all resource tools.] Make multiple line graphs to display and compare given data.
CK-12 Foundation
Ck 12: Statistics: Displaying Categorical Variables
[Free Registration/Login may be required to access all resource tools.] This Concept covers a few ways in which categorical data can be displayed; using bar graphs and pie graphs.
Louisiana Department of Education
Louisiana Doe: Louisiana Believes: Eureka Math Parent Guide: Collecting and Displaying Data
A guide to support parents as they work with their students in collecting and displaying data.
McGraw Hill
Glencoe: Collecting and Analyzing Data Quiz
This site is a quiz with five quick questions to check your understanding of how to collect and analyze data. It is self checking.
CK-12 Foundation
Ck 12: Statistics: Multiple Bar Graphs Grades 6 7
[Free Registration/Login may be required to access all resource tools.] Create multiple bar graphs to display and compare given data.
CK-12 Foundation
Ck 12: Statistics: Multiple Bar Graphs Grade 7
[Free Registration/Login may be required to access all resource tools.] Make multiple bar graphs to display and compare data.
University of Illinois
University of Illinois: Line Graphs
Line graphs are shown and explained here. You can learn what kind of data is best represented using a line graph. There are also line graphs with questions and answers available to help you learn how to read them.
National Council of Teachers of Mathematics
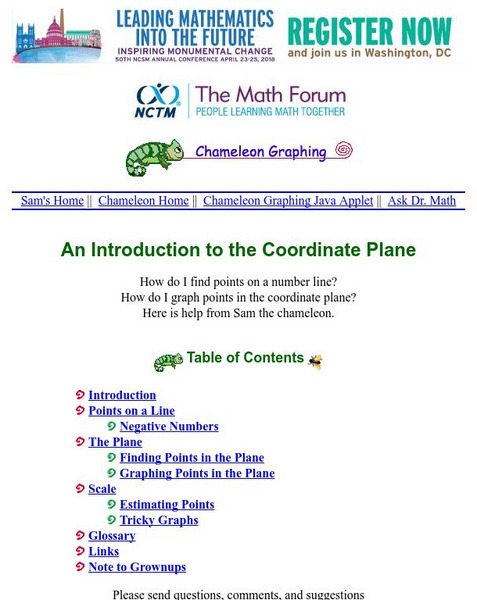
The Math Forum: Chameleon Graphing: Coordinate Plane
Dive into this introduction to graphing in the coordinate plane, and meet a chameleon named Sam. Sam will help guide you through graphing points on a line, using negative numbers, and graphing points in the coordinate plane.
University of Illinois
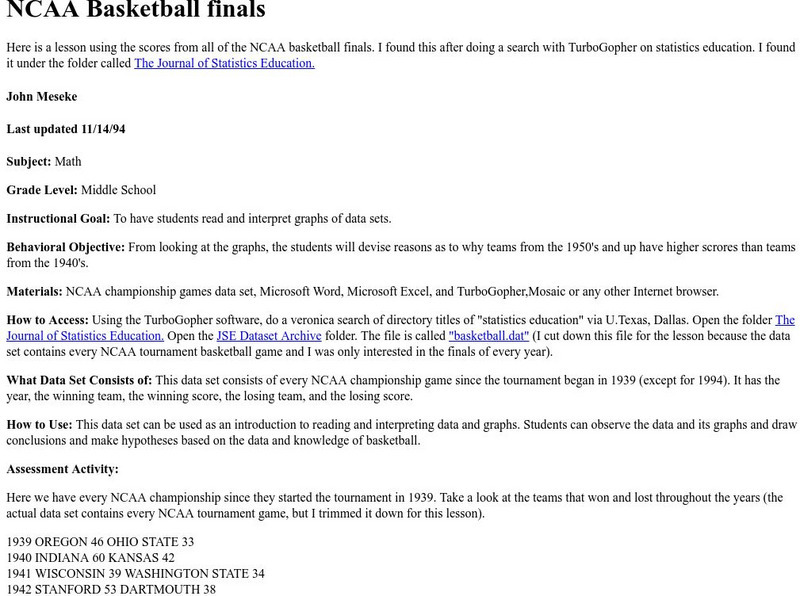
University of Illinois: Ncaa Basketball Finals Bar Graphs
Site from University of Illinois contains a lesson plan that utilizes the NCAA Basketball Final Scores from 1939-1994. Students are instructed to analyze and interpret data displayed in bar graphs.
PBS
Wnet: Thirteen: Ed Online: Growing, Growing, Graphing!
Students explore the growth population of China and use graphs and equations to display data.


