Hi, what do you want to do?
Texas Instruments
Texas Instruments: Social Security Issues
In this activity, you will look at the relationship between the age at which you start drawing social security and the amount drawn. Both graphs and spreadsheets will be used.
Texas Instruments
Texas Instruments: Walking the Line
In this activity, students use linear functions to model and solve problems in situations with slope and a constant rate of change. They learn to represent situations with variables in expressions, equations, and inequalities and use...
Math2
Math2.org: Trigonometry Tables
Three trig tables are provided for student and teacher reference. The first table lists the sine, cosine, tangent, secant, cosecant, and cotangent values of all whole-number angles from 0 to 90. The radian equivalent (to four decimals)...
Texas Instruments
Texas Instruments: From Tables to Graphs
Students learn how to generate a table of values showing the accumulated amounts of a sum of money compounded over n periods. They graph these values and learn how to determine the accumulated amount corresponding to any given period.
Texas Instruments
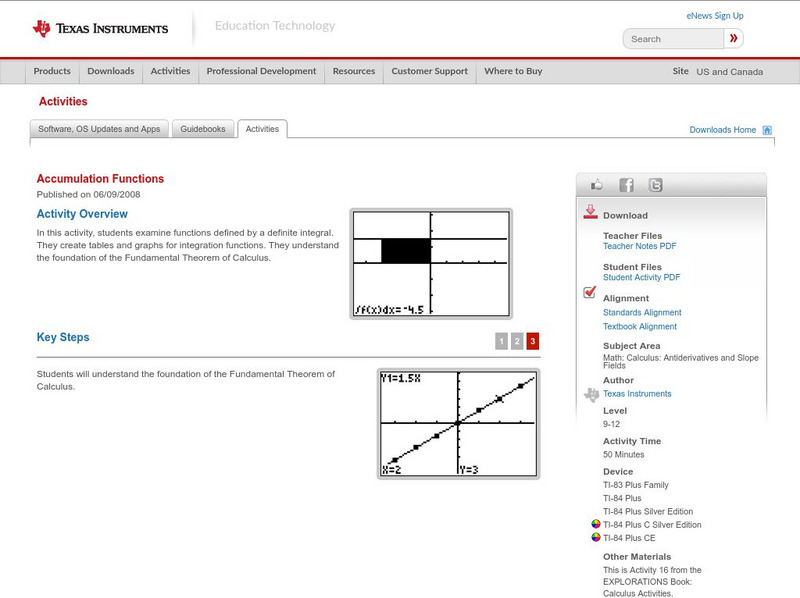
Texas Instruments: Accumulation Functions
In this activity, students examine functions defined by a definite integral. They create tables and graphs for integration functions. They understand the foundation of the Fundamental Theorem of Calculus.
Houghton Mifflin Harcourt
Houghton Mifflin Harcourt: Saxon Activity Center: Graphing Calculator Activity: Average [Pdf]
A concise graphing calculator lesson on calculating average. Detailed examples, demonstrations of calculator functions, and practice problems included. Acrobat Reader required.
Purple Math
Purplemath: Exponential Functions: Introduction
Purplemath offers tables and graphs of various exponential functions for an exploration of how exponential functions behave from the real number domain. Compound interest problems are examined and the natural exponential is discussed...
University of Texas
Inside Mathematics: Granny's Balloon Trip [Pdf]
This task challenges a student to use knowledge of scale to organize and represent data from a table on a graph.
Illustrative Mathematics
Illustrative Mathematics: F If.6 Mathemafish Population
For this task, students are presented with a table and a graph and are asked to summarize the data and report the findings of a project by the Environmental Protection Agency to contain the effects of an invasive species on a fish...
Other
Nearpod: What Is Slope?
In this lesson on slope, students explore how the rate of change can be identified using a graph, a set of points, and a table.
Texas Instruments
Texas Instruments: Math Today Challenge New Color of Money
In this activity, students will read about the changes in the "new money" and then create a graph to represent various combinations of currency produced. This activity provides an excellent example of discrete, real-world data.
Other
Stat Soft: Statistics Glossary
Dozens of statistical terms are defined and illustrated in this glossary.
Texas Instruments
Texas Instruments: Where Should They Hold the Fundraising Party?
Students learn how to create a table of values for a simple linear function and use the table to create a graph on squared paper. They use the graphing calculator to display the ordered pairs and find values of corresponding to values of...
University of Texas at Austin
Mathematics Teks Toolkit: Making Connections
In this lesson, students will use input/output tables to explore functions, equations, and graphs.
Illustrative Mathematics
Illustrative Mathematics: F Bf Latitude
For this task, students are presented with data about latitude and the percentage of the Earth's surface north of each latitude line. They are to use this data to sketch a graph, analyze it, and build an understanding of an invertible...
Math2
Math2
This is a site for students and teachers of all grade levels. If you are looking for math tables, general information about math topics, or you would like to ask a question, this is the site to visit.
CK-12 Foundation
Ck 12: Statistics: Basic Graph Types
[Free Registration/Login may be required to access all resource tools.] Organize distributions of data by using a number of different methods.
Illustrative Mathematics
Illustrative Mathematics: F if the Customers
This is a beginning lesson on the concept of functions. The context is a business that has a database of customer names and phone numbers in a table and students must decide if a function is involved. Aligns with F-IF.A.1 and 8.F.A.1.
Texas Instruments
Texas Instruments: The Quest for Roots of Higher Order Equations
Students learn how to approximate the roots of any polynomial equation of any order by first using tables, and then by tracing along the graph to the point where the curve intersects
Illustrative Mathematics
Illustrative Mathematics: 8.f Us Garbage, Version 1
Eighth graders work with input values (the year) and output values (the amount of garbage that year) in a table about the garbage produced in the US. They study the table to answer specific questions, state whether it represents a linear...
Texas Instruments
Texas Instruments: Getting Started With the Ti Navigator System: River of Life
This lesson introduces students to Activity Center and is intended to help students develop the conceptual understanding of how to identify functions as linear or nonlinear and contrast their properties from tables, graphs, or equations.
Texas Instruments
Texas Instruments: Getting Started With the Ti Navigator: Quadratic Equations
This lesson introduces students to Activity Center and is intended to help students write systems of equations in standard form in slope intercept form to solve the system using tables and graphs.
Illustrative Mathematics
Illustrative Mathematics: F if a Sse Modeling London's Population
In this task, students are shown a table of population data for the city of London and are asked to explore whether a linear, quadratic, or exponential function would be appropriate to model relationships within the data. They are next...
Texas Instruments
Texas Instruments: Limits, Numerically
This activity introduces limits, numerically using tables and graphs.




![Houghton Mifflin Harcourt: Saxon Activity Center: Graphing Calculator Activity: Average [Pdf] Unknown Type Houghton Mifflin Harcourt: Saxon Activity Center: Graphing Calculator Activity: Average [Pdf] Unknown Type](https://static.lp.lexp.cloud/images/attachment_defaults/resource/large/FPO-knovation.png)

