Richland Community College
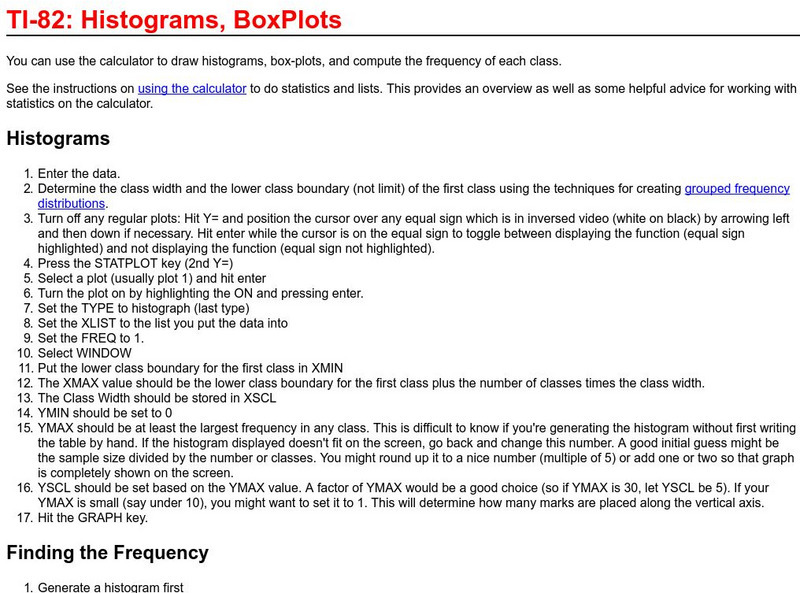
Richland College: Ti 82 Histograms / Box Plots
Richland College provides a step-by-step procedure on how to use a TI-82 to construct histograms and box plots and then use this to find frequency distribution.
Other
Online Statistics Education: Graphing Distributions [Pdf]
This is the second chapter of a statistics e-text developed collaboratively by Rice University, University of Houston Clear Lake, and Tufts University. It looks at many different types of data displays and the advantages and...
ClassFlow
Class Flow: Data Analysis Using Graphing
[Free Registration/Login Required] This flipchart allows students to analyze data using appropriate graphs, including pictographs, histograms, bar graphs, line graphs, circle graphs, and line plots introduced earlier, and using...
Texas Instruments
Texas Instruments: Box and Whiskers
Lesson engages participants in various activities designed to enhance the learners understanding of box and whiskers graphs in various formats.
Texas Instruments
Texas Instruments: Create Box and Whisker Plots
Students use a graphing calculator to create box-and-whisker plots and learn the usefulness of them. Students identify the five summary statistical values of data sets - minimum, first quartile, median, third quartile, and maximum values.
Khan Academy
Khan Academy: Comparing Data Displays
Practice interpreting and comparing dot plots, histograms, and box plots. Students receive immediate feedback and have the opportunity to try questions repeatedly, watch a video or receive hints.
Houghton Mifflin Harcourt
Holt, Rinehart and Winston: Homework Help Independent Practice: Scatter Plots
Get independent practice working with scatter plots. Each incorrect response gets a text box explanation and another try. Correct responses are confirmed.
National Council of Teachers of Mathematics
Nctm: Illuminations: Mean and Median Box and Whisker Plotter
A computer applet that will draw any box and whisker plot with student's data input.
Varsity Tutors
Varsity Tutors: Hotmath: Practice Problems: Box and Whisker Plots
Nine problems present various aspects of using box-and-whisker plots. They are given with each step to the solution cleverly revealed one at a time. You can work each step of the problem then click the "View Solution" button to check...
Varsity Tutors
Varsity Tutors: Hotmath: Algebra Review: Box and Whisker Plots
Find a quick, concise explanation of a Box-and-Whisker Plot. An example is given and clearly explained.
Oswego City School District
Regents Exam Prep Center: Practice With Organizing and Interpreting Data
Several problems are presented to test your skills in creating and interpreting frequency tables, pie charts, box-and-whisker and stem-and-leaf plots.
Other
Nmu: Box and Whisker Plot Instructions
Site discusses the use of box-and-whisker plots. An example is presented and completely worked through, so that the user can see the results of the calculations after the steps have been explained.
Houghton Mifflin Harcourt
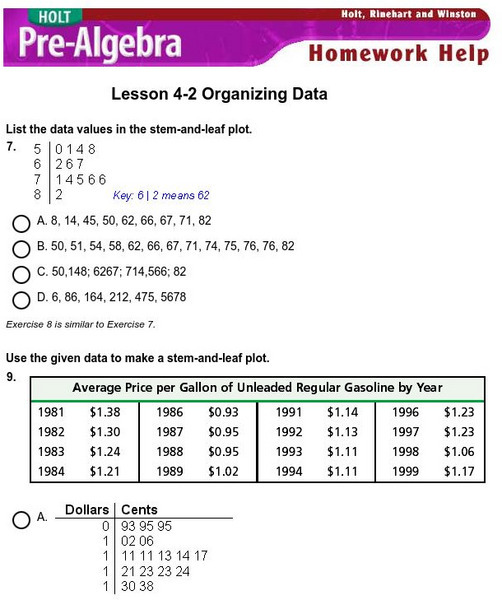
Holt, Rinehart and Winston: Homework Help Independent Practice: Stem and Leaf Plot
Get independent practice organizing data and using stem-and-leaf plots. Each incorrect response gets a text box explanation and another try. Correct responses are confirmed.
Texas Education Agency
Texas Gateway: Selecting and Using Representations for Collected Data
[Accessible by TX Educators. Free Registration/Login Required] Given a variety of data (including line plots, line graphs, stem and leaf plots, circle graphs, bar graphs, box and whisker plots, histograms, and Venn diagrams), the student...
PBS
Pbs Mathline: Button, Button Lesson Plan [Pdf]
An integrated math and language arts lesson plan focusing on statistics. Students explore the concepts of estimation, data collection, data analysis, classification, graphing, and counting through the reading of the Button Box by...
Other
Stat Soft: Statistics Glossary
Dozens of statistical terms are defined and illustrated in this glossary.
Houghton Mifflin Harcourt
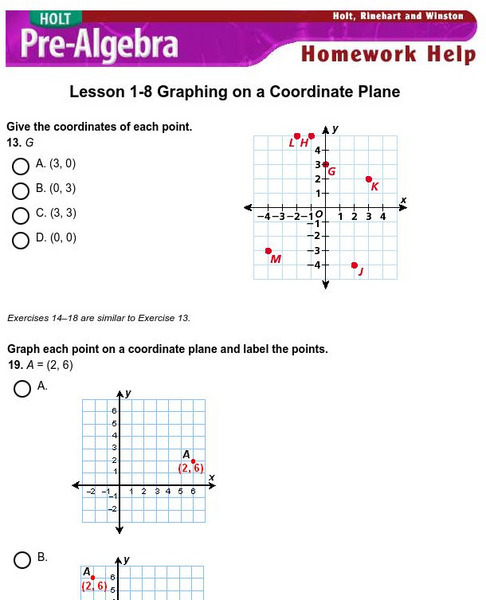
Holt, Rinehart and Winston: Homework Help Independent Practice: Coordinate Plane
Get independent practice identifying points, graphing points and equations on the coordinate plane. Each incorrect response gets a text box explanation and another try. Correct responses are confirmed.
Texas Education Agency
Texas Gateway: Tea Statistics: Descriptive Statistics: Introduction
In these exercises to introduce descriptive statistics, students will construct a histogram and a box plot, calculate univariate statistics, and interpret the data in the graphs.
Texas Instruments
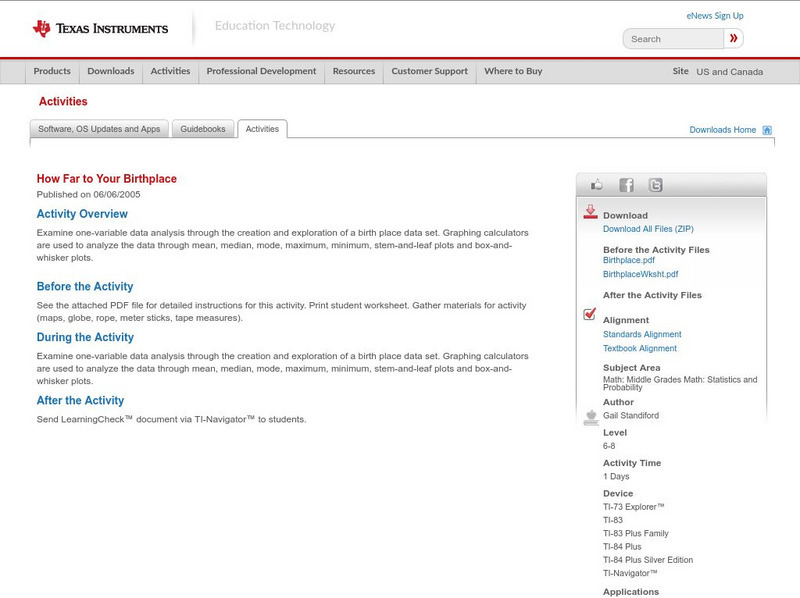
Texas Instruments: How Far to Your Birthplace
Examine one-variable data analysis through the creation and exploration of a birth place data set. Graphing calculators are used to analyze the data through mean, median, mode, maximum, minimum, stem-and-leaf plots and box-and-whisker...
Oswego City School District
Regents Exam Prep Center: Categorizing Data
Three lessons on different types of data (qualitative, quantitative, univariate, bivariate, biased data) as well as a practice activity and teacher resource.
Khan Academy
Khan Academy: Interpreting Quartiles
Practice understanding the meaning of quartiles of data sets. Students receive immediate feedback and have the opportunity to try questions repeatedly, watch a video or receive hints.
Other
Ode: Seventh Grade Achievement Test (Practice Test) [Pdf]
Half-length practice test for the third grade OAT (Ohio Achievement Test). The test includes 17 multiple-choice and 4 open-response questions dealing with topics such as number sense (order of operations, ratios), measurement (metric...

![Online Statistics Education: Graphing Distributions [Pdf] eBook Online Statistics Education: Graphing Distributions [Pdf] eBook](https://static.lp.lexp.cloud/images/attachment_defaults/resource/large/FPO-knovation.png)


