The Franklin Institute
Frankin Institute Online: Group Graphing
This site from The Franklin Institute explores how to make a simple graph using a spreadsheet to portray survey data. It also gives a set of interesting sports-related web sites so that students can get statistical inforamtion.
Science Buddies
Science Buddies: Interpreting Area Data From Maps vs. Graphs
Graphical methods of data presentation are a key feature of scientific communication. This project asks the question, "What's the best way to compare the land area of states: a map or a bar graph?" You'll be measuring performance on two...
Khan Academy
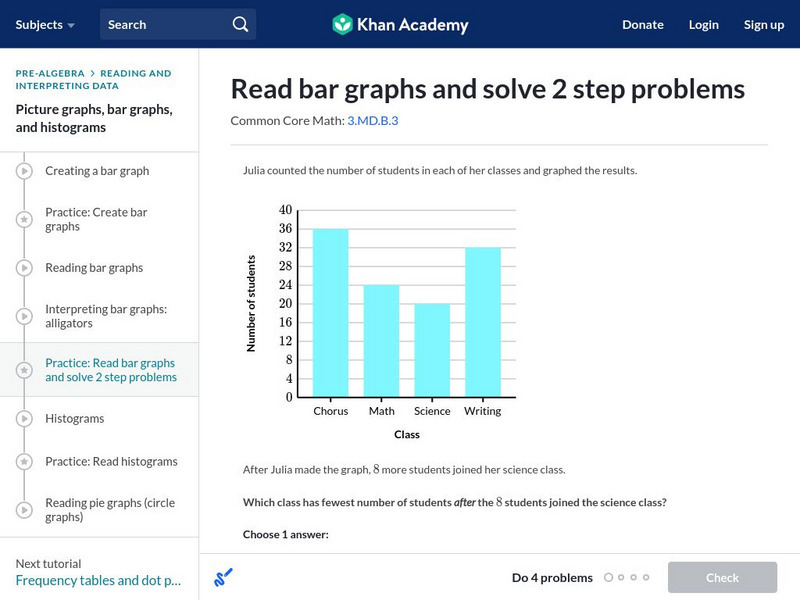
Khan Academy: Read Bar Graphs and Solve 2 Step Problems
Read and interpret a double bar graphs. Students receive immediate feedback and have the opportunity to try questions repeatedly, watch a video or receive hints. CCSS.Math.Content.3.MD.B.3 Draw a scaled picture graph and a scaled bar...
Illustrative Mathematics
Illustrative Mathematics: F if Identifying Graphs of Functions
For this task, students are presented with four function equations and four graphs of functions showing -2 less than or equal to x, which is less than or equal to +2. They are asked to match each function to the corresponding graph and...
E-learning for Kids
E Learning for Kids: Math: Elephant Plant: Data and Graphs
On this interactive website students practice various math skills using a real-life scenario involving plants. Those skills include interpreting data in a circle graph, interpreting data in a divided bar graph, and interpreting a bar...
National Council of Teachers of Mathematics
The Math Forum: Urban Systemic Initiative/oceans of Data
This site includes questions related to reading and understanding graphs. There are links on this site to lesson plans, benchmarks, and other webpages all of which mostly center about probability and statistics.
Other
Socratic: What Is an Acceleration vs Time Graph?
Explains how to construct and interpret an acceleration vs. time graph, and how it would relate to a velocity vs. time graph or a position vs. time graph.
Khan Academy
Khan Academy: Interpret Equations Graphically
Practice the connection between the graphical representation of equations and their algebraic solutions. Students receive immediate feedback and have the opportunity to try questions repeatedly, watch a video, or receive hints.
Illustrative Mathematics
Illustrative Mathematics: 8.f Distance
Eighth graders are presented with the graphs of two cars traveling. One shows distance from home versus time and the other shows speed versus time. Students are to write a description of what might be happening during each car's...
Exploratorium
Exploratorium: Global Climate Change: Research Explorer
Explore scientific data relating to the atmosphere, oceans, areas covered by ice, and living organisms in all these domains. Interpret past and present climate data to predict future climate change and its possible effects.
CK-12 Foundation
Ck 12: Instantaneous Velocity
[Free Registration/Login may be required to access all resource tools.] Students explore instantaneous velocity and how to calculate it. They also learn how interpret and create position vs time graphs.
TeachEngineering
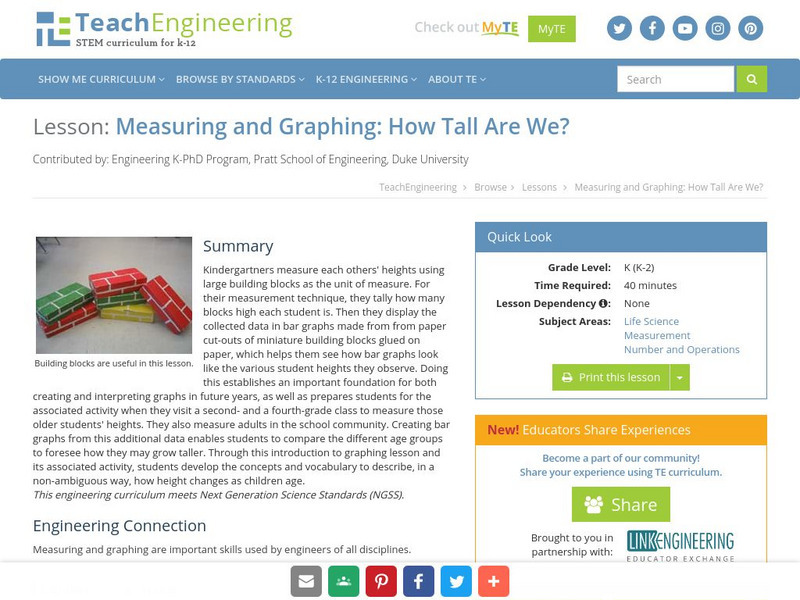
Teach Engineering: How Tall Are We?
Kindergartners measure each other's height using large building blocks, then visit a 2nd and a 4th grade class to measure those students. They can also measure adults in the school community. Results are displayed in age-appropriate bar...
Concord Consortium
Concord Consortium: Exponential Decay
Learn about exponential decay in real-world situations. Problems involve the application of depreciation of an asset and radioactive decay. Learn to apply exponential decay equations and interpret graphs.
Shodor Education Foundation
Shodor Interactivate: Derivate
Explores derivatives and the idea of infinity using a geometric interpretation of slope.
PBS
Pbs Learning Media: Everyday Algebra Plus: Targeted Math Instruction
Algebra lesson focuses on using patterns and relationships to write equations with two variables to represent relationships and patterns in real-world problems, plotting ordered pairs on a coordinate grid, and interpreting the meaning of...
University of Illinois
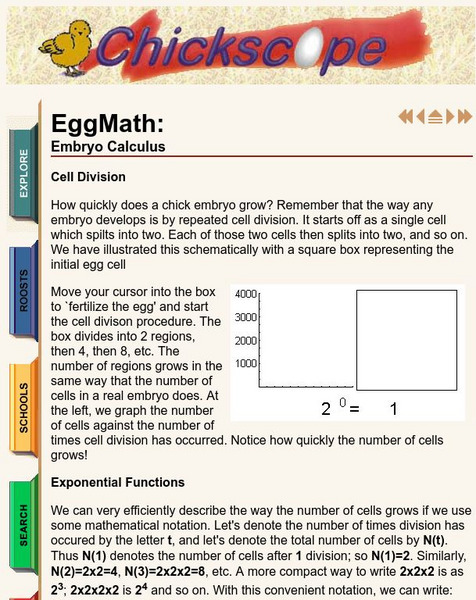
University of Illinois Urbana Champaign: Chickscope Egg Math: Embryo Calculus
This interesting and interactive site offers information and activities on exponential functions, tangents and slopes, and "The number e."
Khan Academy
Khan Academy: Periodicity of Algebraic Models
Given the graph that models a real world context, answer a question about the periodicity of the graph.
Missouri State University
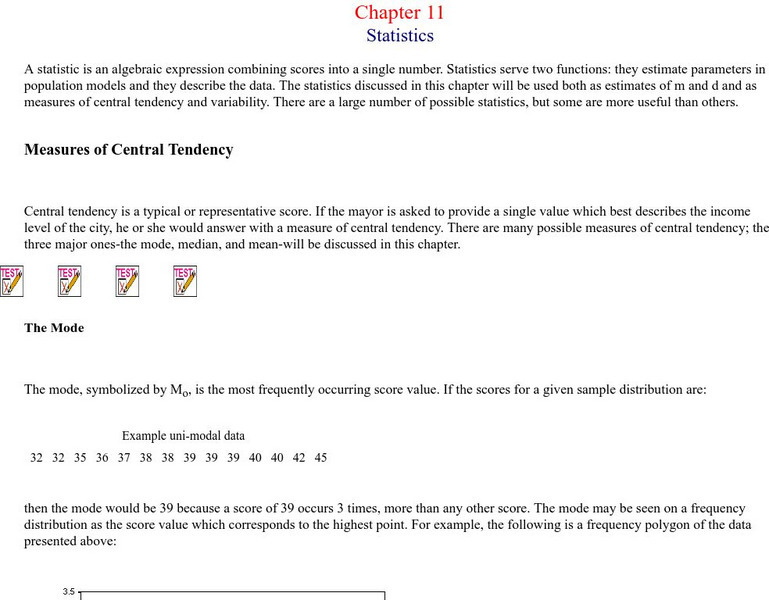
Missouri State University: Introductory Statistics: Statistics
This is an excellent resource on what the science of statistics involves. There are all kinds of definitions, examples, graphs, and charts to learn from. The topics covered include: mode, mean, median, skewed distributions and measures...
Illustrative Mathematics
Illustrative Mathematics: 8.ee Sore Throats, Variation 2
For this task where two saltwater solutions are compared, 8th graders must find equivalent ratios, write an equation that works for both solutions, draw the equation's graph, and interpret the slope as a unit rate. Aligns with 8.EE.B.5.
Council for Economic Education
Econ Ed Link: The Economics of Homebuying
This lesson analyzes the costs and benefits of homeownership and asks the student to describe the factors that affect affordability, use cost-benefit analysis and knowledge of home-buying procedures to reduce the costs, analyze the...
Illustrative Mathematics
Illustrative Mathematics: F Le Taxi!
In this task, students explore the linear relationship between distance traveled and taxi fare cost. Aligns with A-REI.D.10 and F-LE.B.5.
Other popular searches
- Interpret Charts and Graphs
- Interpreting Bar Graphs
- Interpreting Line Graphs
- Interpreting Circle Graphs
- Interpret Graphs
- Reading Graphs and Charts
- Graphs Interpreting Data
- Bar Graph Interpretation
- Reading Graphs in Science
- Timed Reading Graphs
- Interpreting Graphs Algebra
- Math Interpreting Bar Graphs

