Curated OER
Box-and-Whisker
Seventh graders are introduced to the concept of box-and-whisker plots. A step-by-step process for creating a box-and-whisker plot is provided. The goal of the instructional activity is that students study the components of a...
Curated OER
Linking Algebra to Temperature
Young scholars convert between two units as they calculate the temperature. In this algebra instructional activity, students collect data on seasonal climate and create a graph. They make conjectures based on their data collection.
Curated OER
Functions and the Vertical Line Test
Students explore the concept of functions. In this function lesson, students determine if the graph is a function by using the vertical line test. Students use an applet to explore the vertical line test on a variety of graphs.
Curated OER
Relating Distance and Velocity Over Time
Students calculate the distance and velocity over time. In this algebra lesson, students graph a linear function to represent the distance vers time travel. They interpret their graphs and draw conclusion.
Curated OER
Mathematical Models with Applications: The Sounds of Music
Students use an electronic data-collection device to model the sound produced by a guitar string. They identify the graph of a periodic situation and use the graph to determine the period and frequency of sound waves.
Curated OER
Linear Systems
Students solve and graph linear equations. In this algebra lesson, students solve systems of equations using elimination and substitution. They graph their answer and identify the point of intersection.
Curated OER
Mapping a Temperature Field
Students measure and graph temperatures. In this temperature field lesson students use a map to measure and plot field values and construct isolines and interpret the results.
Curated OER
Choosing a Summer Job
What did you do over your summer vacation. Young wage earners must compare summer job options, and determine when each job earn the same amount and what that amount be. This be done by creating, graphing, and solving systems of...
Curated OER
Statistics: Misleading or Accurate?
Students explore the concept of misleading statistics. In this misleading statistics instructional activity, students play a game of tag and graph the number of times each student gets tagged. Students use the graph to determine the...
Curated OER
Linear Patterns in Data
Eighth graders extend their learning of graphing linear equations and are introduced to connecting patterns in tables and graphs to represent algebraic representations. They then determine patterns and extrapolate information from these...
Curated OER
Cartesian Coordinate System
Students explore the Cartesian coordinate plane and plot points on the graph. They interpret coordinates for a point from the graph and give the ratio of rise over run for slope.
Curated OER
Cell Phone Plans
Students relate the use of a cell phone to math. In this algebra lesson plan, students collect data on the usage of their phones and plot it. They analyze the graph and make predictions based on the rate per minute.
Curated OER
Linear Functions-Learn Your Lines
Students solve and graph linear equations. In this algebra lesson, students collect and plot data on a coordinate plane. They use the CBL and TI calculator to graph systems of equation.
Curated OER
Collecting And Fitting Quadratic Data
Pupils investigate the concept of using quadratic data to plot coordinates on a plane. They also apply the quadratic formula for a variety of problems with the help of a graphing calculator to draw the parabola for given coordinates.
Curated OER
Model Data with Quadratic Functions
Students model data using quadratic equations. In this algebra lesson, students simplify and factor quadratic equations. They graph the function using collected data and analyze the parabola.
Curated OER
Different Perspectives of Oregon's Forest Economic Geography
Students map data on employment in wood products manufacturing in Oregon counties. In this Oregon forest lesson, students discover the percentage of people employed in the forest manufacturing industry. Students create a box and whisker...
Curated OER
Evaluating Data
In this data activity, students learn how to organize the data collected during an experiment and practice finding patterns. Students graph a table of experimental data and complete 1 short answer question.
Curated OER
Flips, Turns, and Slides: Adventures with Transformations
Students explore transformations. In this math lesson, students plot points on a coordinate grid and construct shapes. Students discuss movements on the grid as flips, turns and slides.
Curated OER
Business Lesson Describing Trends
Students practice their skills using business English. After a lecture/demo, students interpret economic graphs which are imbedded in this lesson. Then, they create their own graphs and describe them to the class.
Curated OER
Algebra II: Quadratic Functions
Students collect and organize data, make a scatterplot, fit a curve to the appropriate parent function, and interpret the results. Students translate among the various representations of the quadratic function, formulate equations, use a...
Curated OER
What's The Point?
Students solve word problems using the correct math symbols. For this algebra lesson, students use the TI calculator to graph their equation and analyze it. They find the line of regression and use to draw conclusion.
Curated OER
Homework 7: Hares and Foxes (Based on a problem in Cic)
In this system of equations worksheet, students use systems of equations and Euler's method to calculate the population of hares and foxes. They plot and interpret their results. This one-page worksheet contains three multi-step...
Curated OER
Successive Approximation and Euler's Method
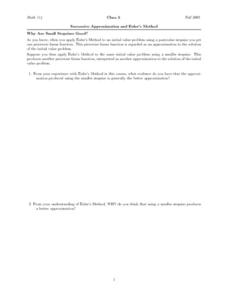
In this approximation activity, students use the Euler's method to interpret a piecewise linear function. They explore why the approximation produced using a smaller stepsize is a better approximation. This four-page activity contains...
Curated OER
Spaghetti Bridges
Eighth graders experiment with building bridges of spaghetti, pennies, and a cup to determine how varying the number of spagetti pieces affects the strength of the bridge. They graph their results and interpret the data.


