US Department of Education
National Center for Education Statistics: Create a Graph Tutorial
This tutorial walks students through how to create different types of graphs using the Create a Graph tool available on the website. Covers bar graphs, line graphs, pie charts, area graphs, scatter plots, and dependent and independent...
Scholastic
Scholastic: Bars, Lines, and Pies
Middle schoolers will learn and reinforce skills for creating, applying and analyzing pie charts, bar graphs and line graphs.
Cuemath
Cuemath: Linear Graph
A comprehensive guide for learning all about linear graphs with definitions, properties, their equations, how to plot or analyze them, solved examples, and practice questions.
Other
Desmos: Water Line
In this real-world activity, students draw a graph of the height of water in a glass as water is being poured into it. They next make their own glass, create an accurate graph for it, and add it to a cupboard of glasses shared by...
The Franklin Institute
Frankin Institute Online: Group Graphing
This site from The Franklin Institute explores how to make a simple graph using a spreadsheet to portray survey data. It also gives a set of interesting sports-related web sites so that students can get statistical inforamtion.
E-learning for Kids
E Learning for Kids: Math: Elephant Plant: Data and Graphs
On this interactive website students practice various math skills using a real-life scenario involving plants. Those skills include interpreting data in a circle graph, interpreting data in a divided bar graph, and interpreting a bar...
Oswego City School District
Regents Exam Prep Center: Scatter Plots and Line of Best Fit
Use this lesson, practice exercise, and teacher resource in planning instruction on scatter plots and line of best fit. In the lessons, you'll find definitions and examples of ways to make a scatter plot, determine correlations, and find...
Better Lesson
Better Lesson: The Double Number Line
The double number line will help students figure out problems that involve two quantities.
Other
Montana State University: Line Integrals
A thorough explanation of line integration and how to represent force fields, include graphs and diagrams for visual reference and examples.
National Council of Teachers of Mathematics
The Math Forum: Graphing Linear Functions
Use this guide to practice graphing linear functions using Claris Works with your students. The lesson walks you through the process of setting up Claris Works step-by-step.
Illustrative Mathematics
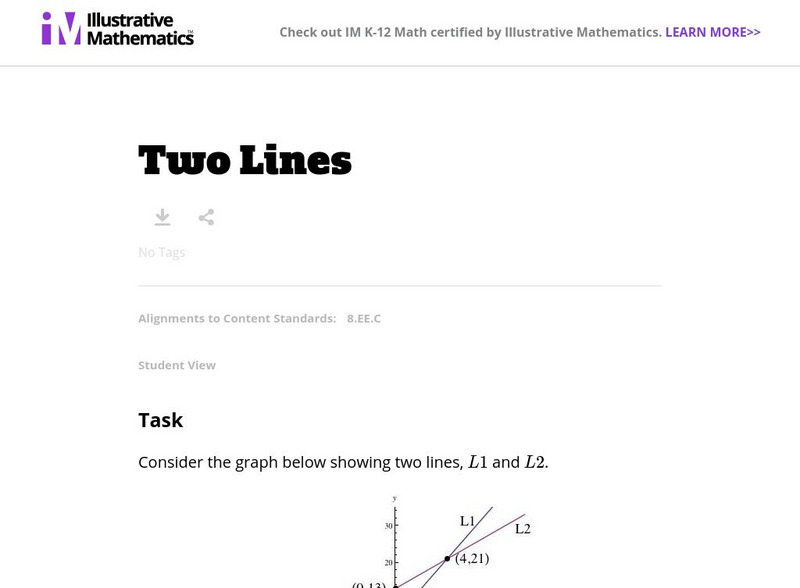
Illustrative Mathematics: 8.ee Two Lines
This task presents students with two line graphs. They are asked to find the linear equations and to identify points unique to each graph. Aligns with 8.EE.C.
Interactive Mathematics
Interactive Mathematics: Graphs of Linear Functions
A brief overview of three methods used to graph lines is presented through examples. Slope-intercept, point-slope, and intercept form are demonstrated step-by-step along with a review of the formula for finding the slope of a line.
Other
Graph Pad: Data Analysis Resource Center
The GraphPad Statistics Guide is both a guide to doing statistical analyses with GraphPad Prism 7, and a concise review of statistical principles, emphasizing clear explanations with very little math. The GraphPad Curve Fitting Guide is...
PBS
Pbs: Logical Leaps: Graphing Inequalities: Rational Numbers
In this interactive, use logic to solve three riddles involving a jumping wallaby competition. Then, using knowledge of inequalities and rational numbers, place the wallabies on the correct range from -5 to 5 on the number line. Numbers...
PBS
Pbs: Logical Leaps: Graphing Inequalities: Fractions, Mixed Numbers, and Decimals
In this interactive, use logic to solve three riddles involving a jumping frog competition. Then, using knowledge of inequalities and rational numbers, place the frogs in the correct range from 0 to 5 on a number line. The fractions,...
California State University
Ca State University, San Bernadino: Graphing Techniques
A survey of math graphing techniques includes horizontal and vertical shifts, stretching, lines of symmetry, even and odd functions, and absolute value functions.
University of Regina (Canada)
University of Regina: Math Central: Linear Graphs
Students gain the knowledge of how to plot and recognize first degree equations on a graph. The lesson has an overview, materials, procedures, and evaluation techniques.
Math Aids
Math Aids: Graph Worksheets
Great resource to practice and strengthen math skills pertaining to graphs. Math worksheets are printable, may be customized, and include answer keys.
Purple Math
Purplemath: Graphing Overview: Straight Lines
This resource provides an overview of graphing for various types of functions, instruction on graphing straight lines and also, includes advice on common mistakes made by students.
Lawrence Hall of Science
The Math Page: Skill in Algebra: The Equation and Graph of a Straight Line
Here is a site that clearly and thoroughly explains the equation of a line, including how to find points on a line, intercepts, and how to recognize the equation of a line. There are example problems solved, problems for the student to...
Khan Academy
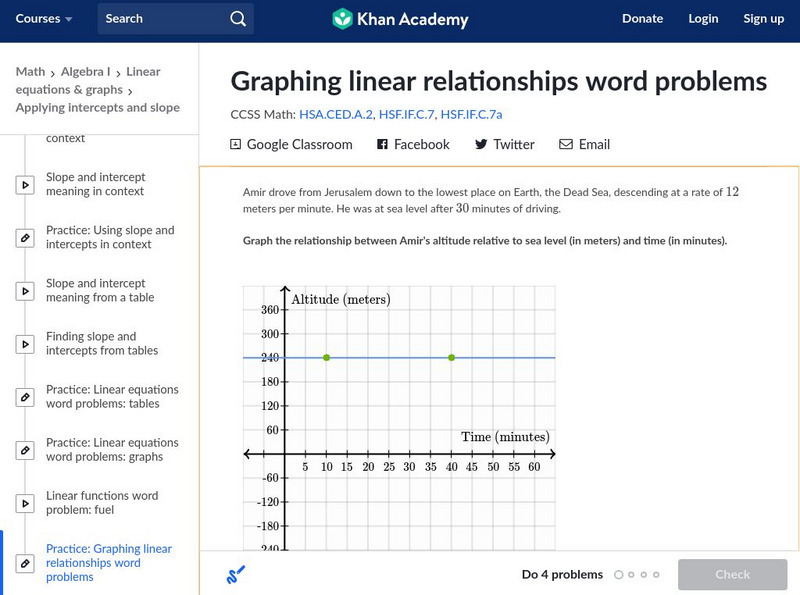
Khan Academy: Graphing Linear Functions Word Problems
Graph the line that represents a real-world relationship that is given verbally. Students receive immediate feedback and have the opportunity to try questions repeatedly, watch a video, or receive hints.
Physics Classroom
The Physics Classroom: 1 D Kinematics: Meaning of Slope for a v T Graph
In this part of a physics lesson, examine how the actual slope value of any straight line on a velocity-time graph is the acceleration of the object.
Washington State University
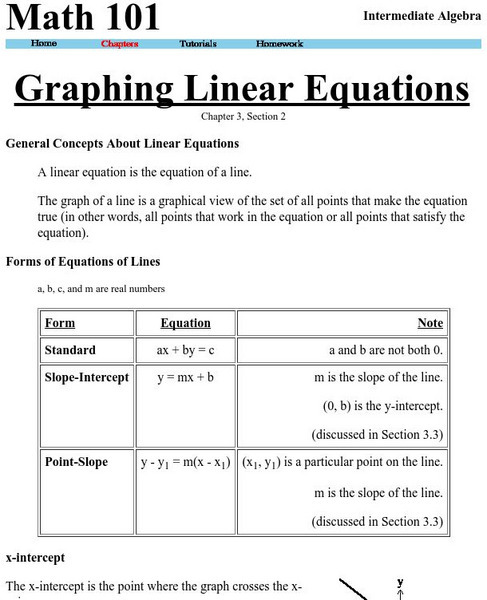
Washington State University: Graphing Linear Equations
This site explains what a linear equation is, general forms of linear equations, how to graph a line using the method of plotting points. The site also details how to find points on the line given the equation, information about the...
University of Regina (Canada)
University of Regina: Math Central: Basics of Graphing
Students learn the basics of graphing including terminology, plotting, and reading points. The lesson has an overview, materials, procedures, and evaluation techniques.
Other popular searches
- Line Graphs
- Double Line Graphs
- Bar and Line Graphs
- Line Pie Bar Graph
- Interpreting Line Graphs
- Line Plot Graphs
- Making Line Graphs
- Reading Line Graphs
- Analyzing Line Graphs
- Creating Line Graphs
- Number Line Graphs
- Reading Double Line Graphs


