Curated OER
Endangered Species
In this geography worksheet, learners identify how to manipulate data on a range of endangered species. They create a bar graph of endangered animals from Africa, Asia, Australia, North America, or South America. Students use a...
Curated OER
Excel temperature Graphs
Students gather data about the weather in Nome, Alaska. For this Nome Temperature lesson, students create an excel graph to explore the weather trends in Nome. Students will find the average weather and add a trend line to their...
Curated OER
Name Count and Graph
Students find the frequency of a name in selected states by using the Internet. They input data into a spread sheet. They create a graph that illustrates the gathered information.
Curated OER
Graphing Data on Ellis Island
Third graders use data to make a bar graph. In this graphing and social studies lesson, 3rd graders use data about where Ellis Island immigrants came from to complete a bar graph on Microsoft Excel.
SeaWorld
Marvelous Manatees
Here is an interesting lesson plan on the manatee for your upper graders or middle schoolers. A game is played where learners work together to complete a successful manatee migration. It's a board game, and all of the game components are...
Curated OER
Temperature Graphing
Fifth graders analyze temperature variations throughout the world by using computer graphing of select major national and international cities.
Curated OER
Temperature Graphing
Students analyze temperature variations throughout the world by using computer graphing of select major national and international cities. After analyzing their findings, students write a paragraph explaining their data.
Curated OER
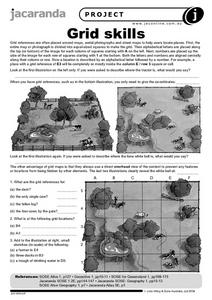
Grid Skills
In this geography worksheet, students use grid references on a map to locate places in the pictures given. They also identify another advantage of using a grid map, which they have an overhead view of the content to prevent any features...
Curated OER
Technology Integration Lesson Plan: Civil War Spreadsheet
Eighth graders discuss and analyze Civil War data, manually graph data on handout, work with partners to enter data into spreadsheets, and create charts on spreadsheet for each data set.


