Curated OER
Build a Bar Graph
Learners discover how to use bar graphs. They will gather and organize specific data in order to put it into a bar graph. Then they will answer several questions based on the information they have graphed.
EngageNY
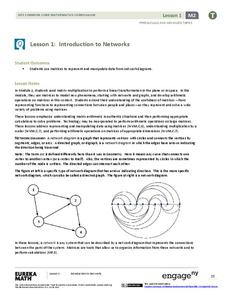
Introduction to Networks
Watch as matrices break networks down into rows and columns! Individuals learn how a network can be represented as a matrix. They also identify the notation of matrices.
Curated OER
Class Birthday Graph
Students analyze the basics of an Excel spreadsheet. They highlight cells in a spreadsheet. They make a column graph. Students are introduced to X-axis and Y-axis. They play various address games on the spreadsheet.
Curated OER
Graphing Data
Second graders graph data about their classmates. In this data analysis activity, 2nd graders ask each other several questions about their hair color and eye color. Students graph the data that they collected.
Curated OER
Apple Graphing
Do you like apples? Create a taste test for your first and second grade learners. Cut red, green, and yellow apples, and have learners select their favorite. After tasting all of the apples, they collect data and graph the results with...
Curated OER
Creating a Spreadsheet and Graph
Students create graphs in Excel. In this spreadsheet lesson, students input data into spreadsheet cells then use the graphing feature of the Excel program to produce colorful graphs of the data. The directions to create the...
Curated OER
Charting and Graphing Sales
Students analyze graphs, charts and tables. For this data analysis lesson, students practice creating and analyzing charts, graphs and tables corresponding to sales and surveys. This lesson uses data relevant to students and includes...
Curated OER
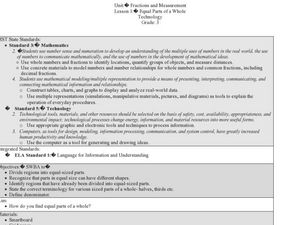
Fractions and Measurement
Using a Smart Board, or a plain ol' white board or chalkboard, the teacher pulls up a grid and demonstrates how squares and rectangles can be divided up into equal parts. The class will get their own graph paper to draw shapes and divide...
Curated OER
Graphing Data
First graders explore the concept of graphing. In this data lesson, 1st graders gather information from a class survey and display their findings on a picture graph. Students also practice solving problems that their instructor models.
Curated OER
Graphing Changes in Weather
Students graph current temperature and weather conditions for three days. In this weather lesson, students go to the Weather Channel's website and look up weather for their zip code then graph the conditions and record the current...
Curated OER
Graphing Integers
Fifth graders explore the math concept of graphing integers. For this graphing integers lesson, 5th graders examine visual examples. Students also practice solving problems that their instructors model.
Curated OER
Excel temperature Graphs
Students gather data about the weather in Nome, Alaska. For this Nome Temperature lesson, students create an excel graph to explore the weather trends in Nome. Students will find the average weather and add a trend line to their...
Curated OER
Using Averages to Create Graphs Through Excel
Sixth graders create and use a spreadsheet to make graphs which will be used to analyze Progress Report and Final Report Card grades. They practice finding the mean, median, mode, and range of a data set. Students also incorporate column...
Virginia Department of Education
Atomic Structure: Periodic Table
The fifth lesson of seven in the series outlines an in-depth analysis of the periodic table. After direct instruction, pupils take turns practicing in the group before beginning independent study. The assessments include a...
Curated OER
Pet Count Excel Graphing
Students used collected data to distinguish what pets they have or would like to have. They correlate findings with appropriate technology--Excel. At the end of the lesson they tabulate a bar chart and present their findings to the class.
Curated OER
Name Count and Graph
Students find the frequency of a name in selected states by using the Internet. They input data into a spread sheet. They create a graph that illustrates the gathered information.
Curated OER
Graphing Absolute value Inequalities
Students investigate the concept of inequalities and practice graphing them at various degrees of difficulty. They review the basic rules with the teacher at the level of theory which may make it harder for them to understand without...
Curated OER
Life Expectancy at Birth
Students create a line graph on the life expectancy for males and females in Canada. In this math and health lesson plan, students review table and graph terminology, create line graphs, and analyze the differences in life expectancy...
Curated OER
Graphing Game
Students explore the concept of graphing ordered pairs. For this graphing ordered pairs lesson, students work in teams to play a version of Connect 4. Students use a Cartesian grid with values -4 to 4 as their Connect 4 board. Students...
Curated OER
Graphing Data on Ellis Island
Third graders use data to make a bar graph. In this graphing and social studies lesson, 3rd graders use data about where Ellis Island immigrants came from to complete a bar graph on Microsoft Excel.
SeaWorld
Marvelous Manatees
Here is an interesting lesson plan on the manatee for your upper graders or middle schoolers. A game is played where learners work together to complete a successful manatee migration. It's a board game, and all of the game components are...
Curated OER
Graphing
Fifth graders create graphs based on climate in South Carolina. They read and interpret information in a chart and construct a graphy from the information in the chart. They create a spreadsheet using Excel and publish 2 graphs.
Curated OER
Our Favorite Season Lesson Plan
Fifth graders complete a survey about their favorite season of the year. Using Excel, they create a graph using the chart wizard and copy it into Microsoft Word. They explore the relationship between the survey and the bar graph.
Curated OER
A Fishy Tale
Eighth graders do a research project on a particular species of Atlantic seafood and record and graph information pertaining to commercial landings of that species of seafood. They use a website and an Appleworks spreadsheet.


