PBS
Pbs: Interpreting Stories and Graphs
This interactive exercise focuses on how line graphs can be used to represent mathematical data and provides an opportunity to translate actions from a story into graph form, then to write your own story to coincide with a line graph.
CK-12 Foundation
Ck 12: Algebra: Lines in the Coordinate Plane Study Guide
This comprehensive study guide highlights the main terms and formulas needed to review lines in the coordinate plane. Examples are included.
University of North Carolina
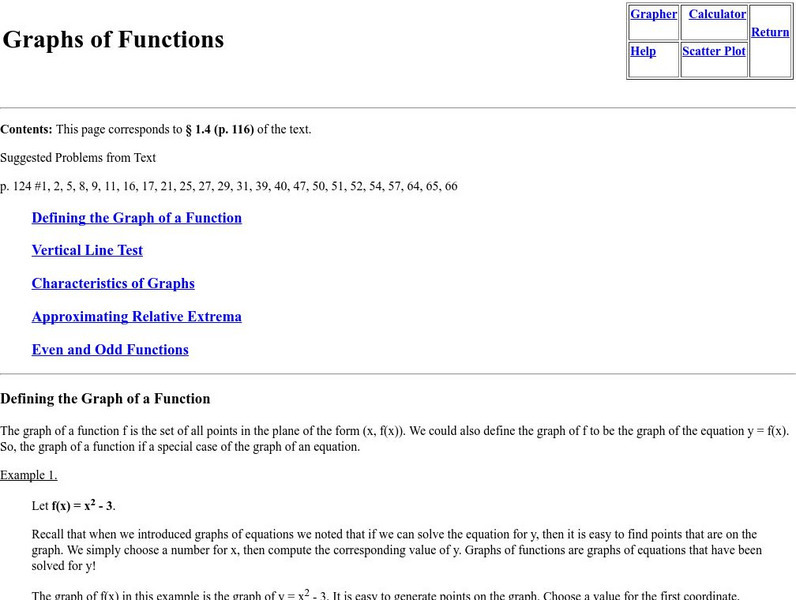
University of North Carolina Wilmington: Graphs of Functions
Defining the graph of a function, vertical line test, characteristics of graphs, approximating relative extrema, and even and odd functions are covered with examples that include charts and graphs.
Texas Education Agency
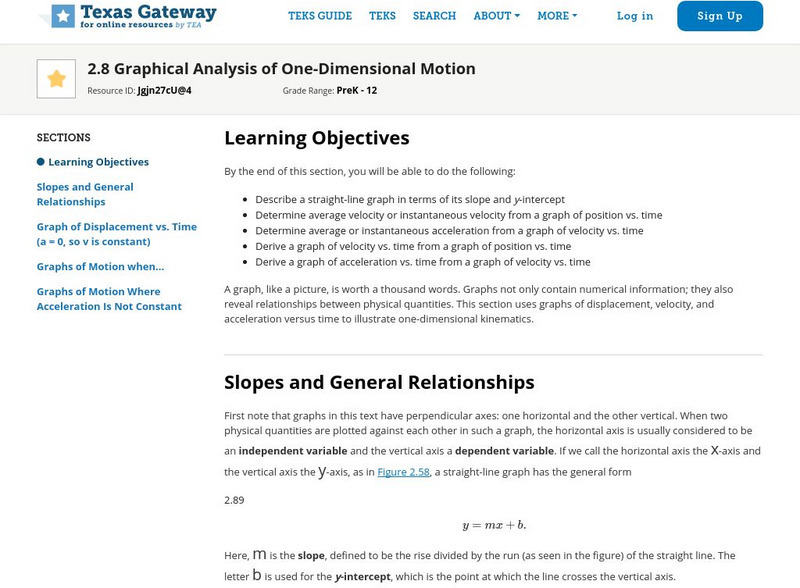
Texas Gateway: Kinematics: Graphical Analysis of One Dimensional Motion
By the end of this section, you will be able to describe a straight-line graph in terms of its slope and y-intercept, determine average velocity or instantaneous velocity from a graph of position vs. time, determine average or...
Khan Academy
Khan Academy: Parallel & Perpendicular Lines From Graph
Given points that two lines go through or the graph of each line, classify the lines as parallel, perpendicular, or neither.
Illustrative Mathematics
Illustrative Mathematics: 8.ee Equations of Lines
In this task, 8th graders are presented with two intersecting line graphs and their linear equations. No values are shown on the axes. They are asked to interpret the constants in the equations in terms of their graphs, and make some...
PBS
Pbs: Manipulating Graphs
Watch how a graph is altered when key elements of the equation change. This lesson focuses on how to manipulate the equation of a line in slope intercept form to match the graphs provided deepening the understanding of both the slope and...
PBS
Pbs: Logical Leaps: Graphing Inequalities: Fractions and Decimals From 0 to 1
In this interactive, use logic to solve three riddles involving high-jump performers in a flea circus. Then, using knowledge of inequalities, place the fleas in the appropriate range on a vertical number line. Numbers are randomized so...
Khan Academy
Khan: Lsn 8: Interpreting Relationships in Scatterplots/graphs/tables/equations
This lesson focuses on Interpreting and analyzing linear, quadratic, and exponential models and graphs. Students will use best fit lines to interpret contexts, distinguish whether contexts are linear or exponential functions, use the...
Student Achievement Partners
Illustrative Mathematics: Equations of Lines [Pdf]
In this instructional activity, students are to interpret graphs with equations of lines.
CK-12 Foundation
Ck 12: Geometry: Lines in the Coordinate Plane Study Guide
This study guide on lines in a coordinate plane covers key terms, what different line slopes look like, postulates about parallel and perpendicular lines, the slope-intercept equation, how to graph parallel and perpendicular lines, and...
PBS
Pbs: Graphing a System of Equations
Solve a number riddle by finding the point of intersection for two lines. This video focuses on finding the solution for a system of equations, they are represented as an algebraic expression and a set of linear equations that are...
Illustrative Mathematics
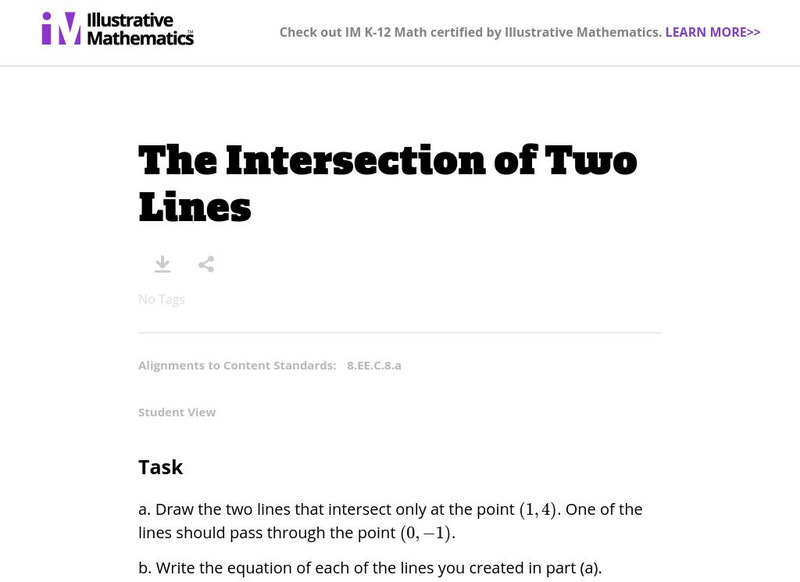
Illustrative Mathematics: The Intersection of Two Lines
The purpose of this task is to introduce students to systems of equations. It takes skills and concepts that students know up to this point, such as writing the equation of a given line, and uses it to introduce the idea that the...
Illustrative Mathematics
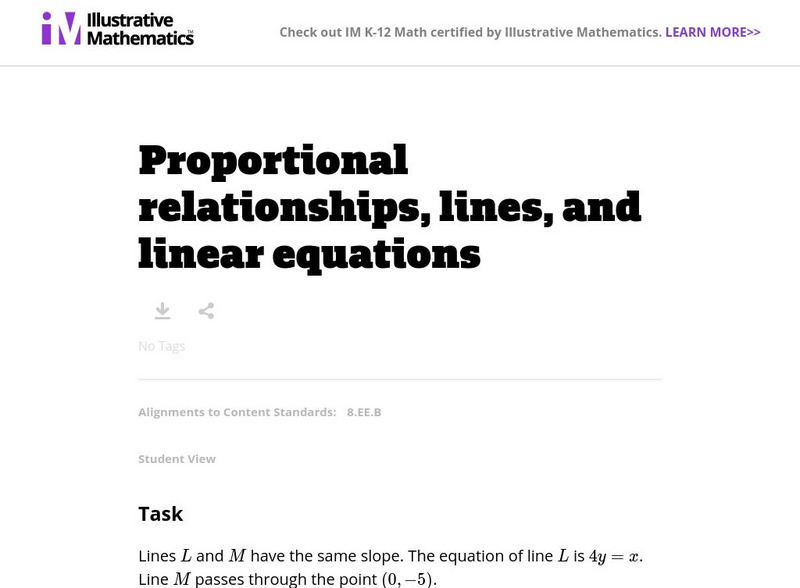
Illustrative Mathematics: 8.ee Proportional Relationships, Lines, and Equations
In this task, 8th graders are shown the graphs of two lines with the same slope. They are given the equation for the first line and the coordinates of a point on the second and are asked to find the equation for the second line. Aligns...
Other
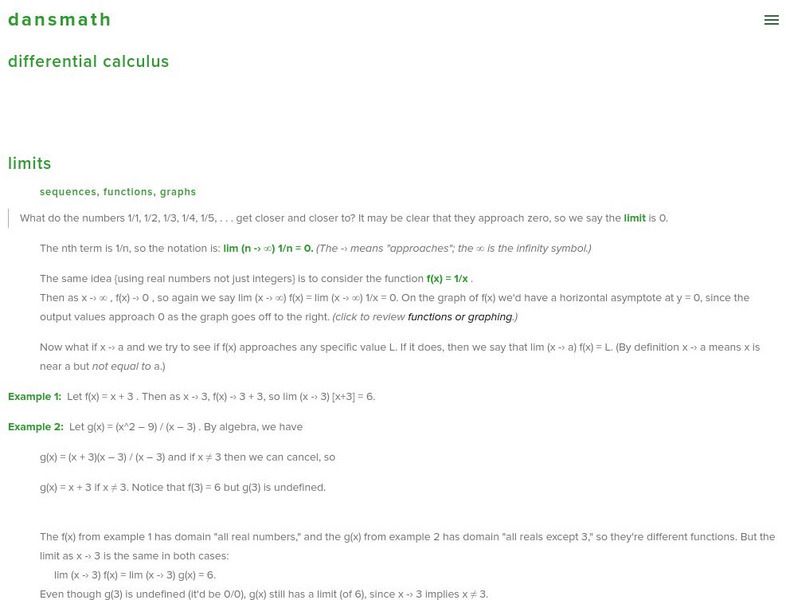
Dans Math: Lessons: Calculus (Part 1)
College professor Dan Bach reviews the basic calculus concepts of limits and derivatives. The site includes examples and animated graphs.
Scholastic
Scholastic: Cultivating Data
Students will understand key concepts of data analysis and their graphic representations. Students will construct and interpret data tables, line plots, box-and-whisker plots and stem-and-leaf plots, scatterplots with line of best fit,...
University of North Carolina
University North Carolina Wilmington: Inverse Functions
Take a look at inverse functions from their definition to graphing them. This site also shows you how to find the inverse of a function.
EL Education
El Education: A Field Guide to East Bog Swamp
This micro-field guide was created by 5th and 6th graders in Marlboro, Vermont. Groups of 3 or 4 students worked together to investigate their own 3 by 3 foot research plot, over multiple visits, and then created a field guide to their...
Oswego City School District
Regents Exam Prep Center: Regression Analysis
A collection of lesson ideas, a practice activity, and teacher resources for exploring regression analysis.
Texas Instruments
Texas Instruments: Boat Registration and Manatee Deaths in Florida
Students will explore the data on boat registrations and manatee deaths in Florida. They will use the data, the graph of the data and the line of best fit to make predictions about the relationship of the data.
Shodor Education Foundation
Shodor Interactivate: Derivate
View the graph and the equation of the line tangent to any function at any point on the function.
Other popular searches
- Line Graphs
- Double Line Graphs
- Bar and Line Graphs
- Line Pie Bar Graph
- Interpreting Line Graphs
- Line Plot Graphs
- Making Line Graphs
- Reading Line Graphs
- Analyzing Line Graphs
- Creating Line Graphs
- Number Line Graphs
- Reading Double Line Graphs

