EngageNY
Describing Center, Variability, and Shape of a Data Distribution from a Graphical Representation
What is the typical length of a yellow perch? Pupils analyze a histogram of lengths for a sample of yellow perch from the Great Lakes. They determine which measures of center and variability are best to use based upon the shape of the...
Curated OER
North American Biomes
In this Science activity, students color a biome map of North America. Students color the map by solving the clues listed on a separate sheet of paper.
Curated OER
Furniture Vocabulary
In this ESL worksheet, students focus on words associated with furniture. Students complete 8 fill in the blank questions, 7 crossword answers, and use the interactive website to self check answers.
Curated OER
Vermont History True / False
In this Vermont history worksheet, learners read two and a half pages of information about Vermont history. After reading, students complete 10 true or false questions about what they read.
Curated OER
Why is the Ocean Salty?
For this ocean salt worksheet, students read about the processes that have lead to the salt content in the ocean. Then students complete 5 short answer questions.
Curated OER
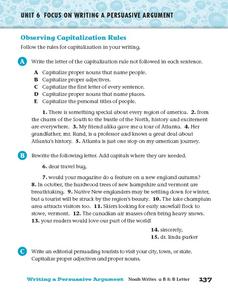
Observing Capitalization Rules
In this capitalization worksheet, students complete three activities that help them follow the rules for capitalization in their writing.


