CK-12 Foundation
Broken-Line Graphs: Heating Curve of Water
Examine the unique graphs coined broken-line graphs. Using the phase change of water for data, learners answer questions related to the temperature and energy at different times in the cycle of the phase change. Questions focus on the...
Curated OER
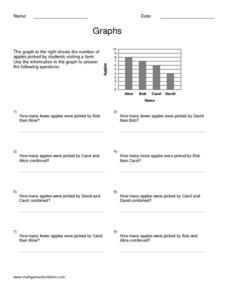
Graphs
In this graphing worksheet, students read information and study diagrams about graphing. Students complete 3 graphing activities.
Curated OER
Why Are Hot Things Red?
In this radiation and temperature worksheet, students use 2 methods to derive the Wein Displacement law that shows the relationship between the temperature of a body to the frequency where the Planck curve's value is at its maximum....
Curated OER
Satellite Drag and the Hubble Space Telescope
In this satellite drag and Hubble space telescope worksheet, students solve two problems using a graph showing the altitude of the satellite vs. the year with two lines showing two different types of re-boost and one line without...
Other popular searches
- Heating Curve of Water
- Science Graph Heating Curve
- Heating Curve Lab
- Chemistry Heating Curve
- Heating Curve Formula
- Science Heating Curve
- Construct Heating Curve
- Heating Curve Lesson Plan
- Heating Curve Worksheet


