Curated OER
Analyzing Graphs and Data
Students collect and analyze data. In this statistics lesson, students graph their data and make inferences from the collected data. They display their data using graphs, bar graphs, circles graphs and Venn diagrams.
Curated OER
Stem-and-Leaf Plots
Students are introduced to stem-and-leaf plots and calculating the mean, median, and mode from the plots.
Curated OER
Structures Of Life
Learners investigate the basic conceptual structures of plants, with the focus being the parts that contain seeds. They comprehend that organisms that have fruit for the holding of seeds for replication of the species. The students work...
Curated OER
Tag It and Bag It: Archeology Lab Lesson
Seventh graders practice analyzing, collecting and categorizing artifacts. Using charts, they organize and interpret information about the artifacts they classified. They work together to create a graph to represent class totals and...
Curated OER
Smile Metric Style
Students practice working with the metric system by measuring and recording the lengths of their smiles.
Curated OER
Smile Metric Style
Pupils measure the length of student smiles and then record, order and graph their results.
Curated OER
SMILE METRIC STYLE
Students accurately use a metric ruler to measure length. They find a sum of multiple metric measurements.
Curated OER
Smile Metric Style
Learners practice working with the metric system. Students use a metric ruler to measure and record lengths of group member's smiles, and graph their results. Learners find the sum of all the smiles.
Curated OER
We Are Having a Party! Part II
Second graders, in groups, participate in a four-station rotation model to solve problems. They use coins and dice for stations one, two, and three.
Better Lesson
Better Lesson: Histogram Activity
Sixth graders will see how an actuary uses histograms to analyze the frequency of events to determine risk.
Texas Instruments
Texas Instruments: Glencoe: Graphing Calculator Investigation Histogram
Students will make histograms, find the frequency of each interval and explore the domain.
Shodor Education Foundation
Shodor Interactivate: Histogram
View histograms for built-in or user-specified data. Experiment with how the size of the class intervals influences the appearance of the histogram.
Texas Instruments
Texas Instruments: Reaction Time
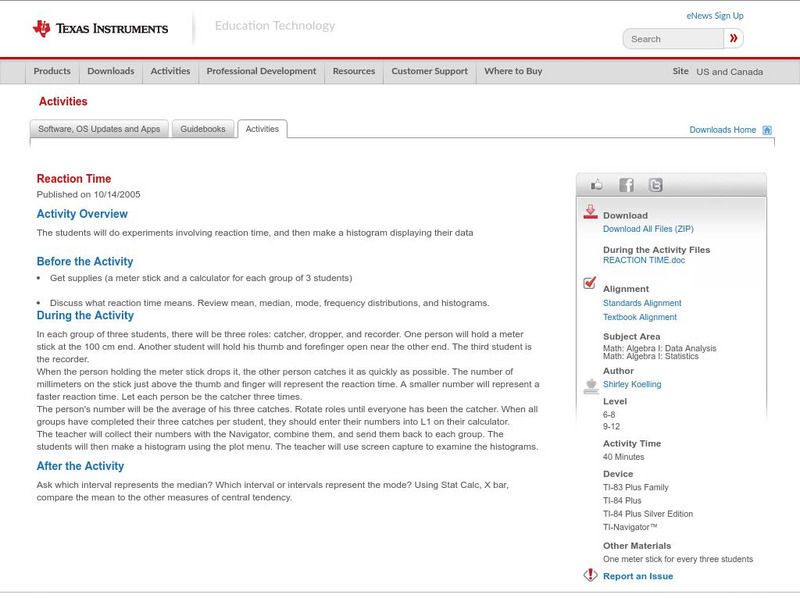
The students will do experiments involving reaction time, and then make a histogram displaying their data.
Shodor Education Foundation
Shodor Interactivate: Multi Bar Graph
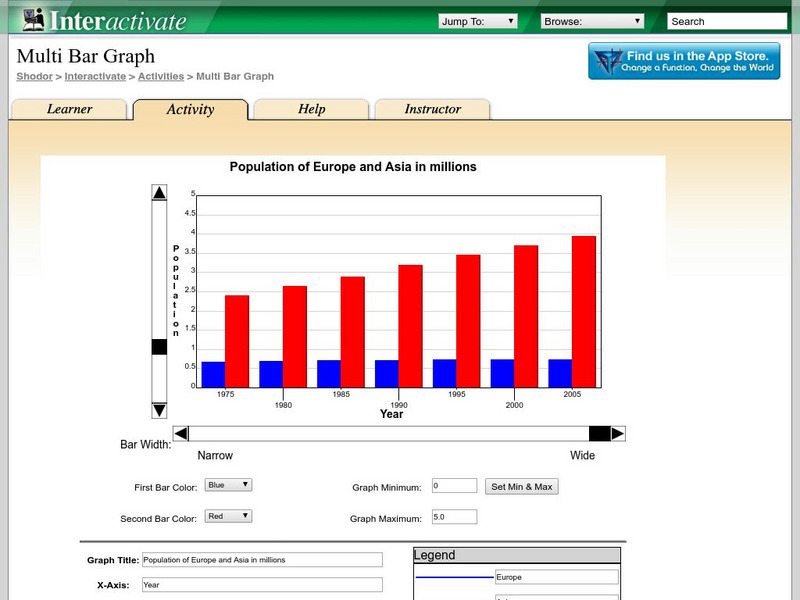
The interactive learning activity allows students to manipulate a double bar graph. Teacher resources are included.
Shodor Education Foundation
Shodor Interactivate: Normal Distribution
Change the standard deviation of an automatically generated normal distribution to create a new histogram. Observe how well the histogram fits the curve, and how areas under the curve correspond to the number of trials.
Texas Instruments
Texas Instruments: Numb3 Rs: No Desk Left Behind
Based off of the hit television show NUMB3RS, this lesson simulates a situation at a school, in which a principal is determining the number of desks needed in order to accommodate left-handed students. A simulation is used in which 10%...
Texas Instruments
Texas Instruments: Beverage Tests
In this activity, students determine the pH of liquid samples. They get familiar with the pH scale, create graphs comparing pH levels, and compare data displayed as a scatter plot, a boxplot, a histogram, and a bar graph.
Texas Instruments
Texas Instruments: Call It Dominant or Recessive
In this activity, students simulate a Punnett square of a cross between two heterozygous individuals and produce a histogram. They compare actual and expected results of genetic crosses.
Texas Instruments
Texas Instruments: Selection Direction
In this activity you will produce histograms using the Data Graphs Wizard and learn about the concept of biological variance.
Texas Instruments
Texas Instruments: Now You See It, Now You Don't
In this activity, students study the relationship between age and near point accommodation (NPA). They predict a person's age using NPA distance values. They use exponential regression, create box-and-whisker plots and histograms.
Texas Instruments
Texas Instruments: Measure Up
In this activity, students compare their height with the average height of students in the class. They create histograms to analyze the data, and construct box plots to summarize the height statistics.
Texas Instruments
Texas Instruments: Cannibal Critters and Cannibal Critters Cont.
Students will explore probability and statistics using predictions and histograms. Theoretical and experimental probability will also be examined.
Texas Instruments
Texas Instruments: Comparing Distributions of Univariate Data
Students compare univariate data distributions using statistical concepts like box plots, stem plots, and histograms.


