Other
Laus Dnet: Grade 5 Excel Lesson Plan
In this online instructional activity, students will survey students in their school to determine their favorite type of hand-held ice cream. Before performing the survey, students will make predictions about which ice creams they think...
University of Georgia
University of Georgia: Definitions in Statistics
This site contains definitions to use in statistics and ways to collect data.
Beacon Learning Center
Beacon Learning Center: Kinds of Graphs
An interactive web lesson introduces five types of graphs to students and allows them to practice matching the names to examples.
Quia
Ixl Learning: Frequency Tables
Brush up on your math skills relating to frequency tables then try some practice problems to test your understanding.
Shodor Education Foundation
Shodor Interactivate: Lesson: Stem and Leaf Plots
Lesson plan introduces students to stem-and-leaf plots. Many resources are available for student and teachers here.
Science Buddies
Science Buddies: Dry Spells, Wet Spells: How Common Are They?
Here's a project that looks at what the weather was like for over a hundred years. The goal of the project is to compare long-term precipitation patterns in different regions of the country. You will work with historical climate data,...
Other
Ohio Department of Education: Sixth Grade Achievement Test (Practice Test) [Pdf]
Half-length practice test for the third grade OAT (Ohio Achievement Test). The test includes 17 multiple-choice and 4 open-response question dealing with topics such as geometry (triangle identification, surface area), number sense...
Khan Academy
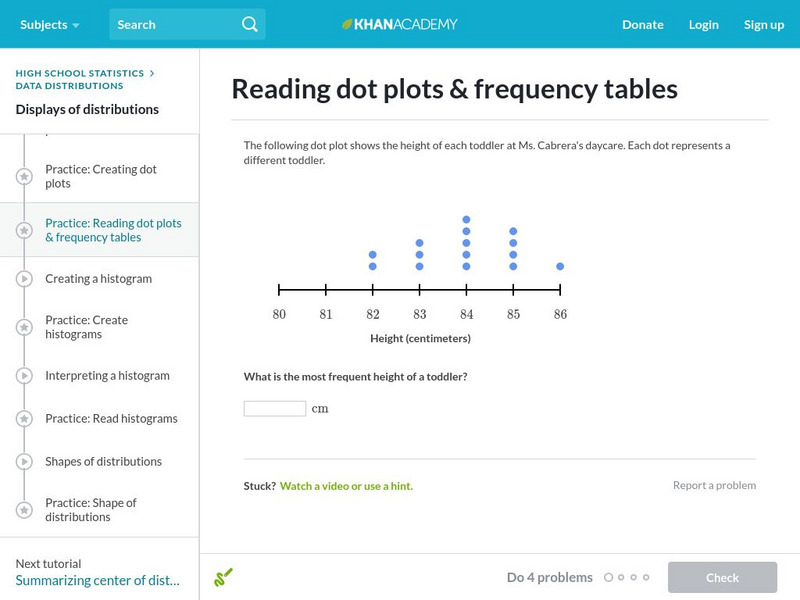
Khan Academy: Reading Dot Plots and Frequency Tables
In this exercise, students practice reading dot plots and frequency tables. Students receive immediate feedback and have the opportunity to get hints and try questions repeatedly.
Science Education Resource Center at Carleton College
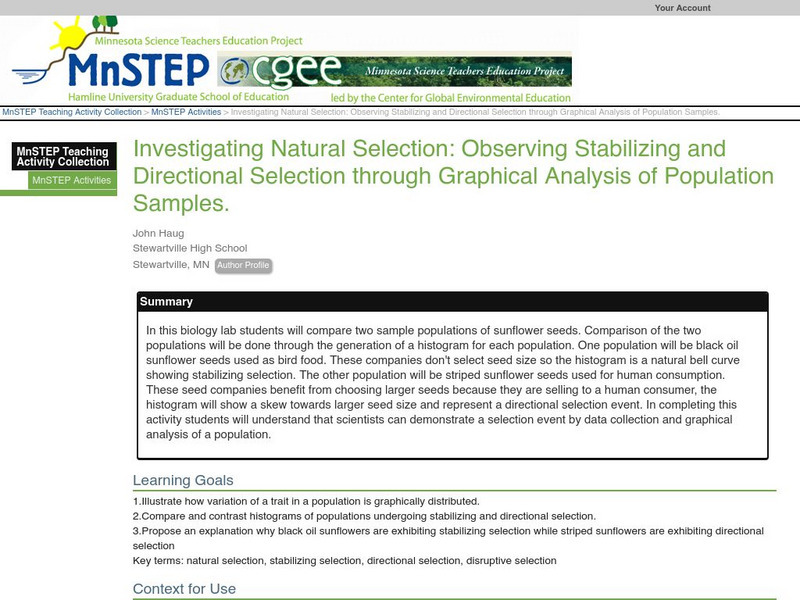
Serc: Investigating Observing Stabilizing and Directional Selection
In this biology lab students will compare two sample populations of sunflower seeds. Comparison of the two populations will be done through the generation of a histogram for each population. One population will be black oil sunflower...
Texas Instruments
Texas Instruments: Beverage Tests
In this activity, students determine the pH of liquid samples. They get familiar with the pH scale, create graphs comparing pH levels, and compare data displayed as a scatter plot, a boxplot, a histogram, and a bar graph.
Other
Oswego City School District: Trimmed Mean
This site presents a histogram showing data used to find the trimmed mean.
BSCS Science Learning
Bscs: Globe at Night Dark Skies
In this inquiry, students predict the best place to stargaze in Arizona based on the brightness of the night sky. Students are introduced to the concept of light pollution and Globe at Night, a global citizen science project in which...
BSCS Science Learning
Bscs: Globe at Night Dark Skies
In this inquiry, students predict the best place to stargaze in Arizona based on the brightness of the night sky. Students are introduced to the concept of light pollution and Globe at Night, a global citizen science project in which...
University of Georgia
University of Georgia: Inter Math: Box and Whisker Plot
Description of box-and-whisker plots and their uses, along with a visual representation. There are links to related terms, everyday examples, more information, and the interactive checkpoint involving box and whisker plots located in the...
Richland Community College
Richland Community College: Stats Graphs Defined
Richland Community College provides a glossary of many terms that are needed in order to understand statistics graphs and charts. Each of the types of charts is quickly explained in terms of what it is most effective in displaying.
Curated OER
Oswego City School District: Trimmed Mean
This site presents a histogram showing data used to find the trimmed mean.


