Pennsylvania Department of Education
Problem Solving with Fractions
Solve story problems using fractions or decimals. Then, determine the reasonableness of answers using estimation.The detailed lesson includes essential questions, vocabulary, a materials list, and links to related units.
Curated OER
Mapping a Site Using a Coordinate Plane
Learners map their playground as if it were an archeological site. They locate objects on the playground and determine their location using coordinate points. A related lesson is Coordinate Grid: Mapping an Archeological Site.
Curated OER
Using Light and Shadow to Create a Sense of Character
Learners heighten awareness and mastery of the subtle factors of drawing technique. Activities focus solely on the human figure, particularly the face. students list 5 of elements of light and shadow which affect portrayal of character...
Curated OER
Development of the Atomic Theory
For this atomic theory worksheet, students complete a paragraph describing the development of the atomic theory by filling in the blank with 21 terms.
Curated OER
Usage and Interpretation of Graphs
Cooperative groups are formed for this graphing activity. Each group must construct a graph that represents how many eyelets (the holes for laces in shoes), are present in their group. A whole-class bar graph is eventually constructed...
Curated OER
How to Draw a Bar Chart Correctly
Your class has gathered their data, so what's the next step? They need to display and analyze their data, and a bar chart is a perfect tool for the job. This resource provides the step-by-step instructions those kids need to construct a...
Curated OER
Graphs to Represent a Data Set
Here are Jack's hours for the week; scholars organize them into a bar graph in this data analysis worksheet. They write the days along the y-axis and hours along the x-axis. Encourage labeling for this. Consider projecting as an...
Curated OER
Worksheet 14 - Rates
In this rate worksheet, students draw and label given situations, determine the rates and the relationship between them. This two-page worksheet contains 7 multi-step problems.
Curated OER
Slavery: Population Growth in Arkansas
Eighth graders examine the number of slaves in Arkansas in each census period from 1820 to 1860. They graph the data using the proper labeling and write a paragraph summarizing the data from each period making comparisons between slave...
Curated OER
Double Bar Graphs - Homework 7.1
Your learners have seen basic bar graphs, but do they have experience reading double bar graphs? This learning exercise details how to draw a double bar graph and provides an example with six accompanying questions. The final question...
Curated OER
Study Buddies: Reading Line Graphs
For this math worksheet, students will work with a coach to solve a problem by reading a line graph. Students will follow a step-by-step process and notes are provided for the coach.
Curated OER
Comparison of Images Formed by Plane, Cylindrical and Spherical Mirrors
Young scholars experiment with differently shaped mirrors. In this reflection and optics instructional activity, students investigate the visual effects of reflected images in mirrors. They use plane, cylindrical, and concave mirrors for...
Curated OER
Hollywood's Top Ten
Students gather data on top 10 highest grossing movies, and make a bar graph and a pictogram.
Curated OER
Find the Mystery Lines...If You Can!
In this atomic spectral lines worksheet, learners observe a diagram of the spectral lines, their different wavelengths and their intensity. They solve 4 problems which include interpreting the scale, matching up tabulated lines with the...
Pennsylvania Department of Education
Using the Coordinate Plane in Problem Solving
Fifth graders practice solving problems. In this fraction and decimal lesson plan, 5th graders recognize the relationship between fraction and decimals. Students estimate problem results and write expressions to use for problem solving.
Curated OER
Bar Graphs
In this bar graph worksheet, students read about making quality bar graphs and they make a bar graph using given data. They answer 5 questions about their graph.
Curated OER
Line Graphs
In this algebra worksheet, students describe the relationship between a line graph and its data. They define the reasons line graphs are used and discuss increasing and decreasing lines. There is one involved questions, requiring several...
Curated OER
Standard Form of Quadratic Functions
Young scholars factor quadratic equations. In this algebra lesson, students identify the factors and use them to graph the parabola. They find the parameters and vertex of each graph.
Curated OER
Scatter Plots
For this Algebra I/Geometry/Algebra II worksheet, students create a scatter plot and analyze the data to determine if the data show any type of correlation. The four page worksheet provides extensive explanation of topic, step-by-step...
Curated OER
A Simple Thermoetric Titration
In this thermometric titration worksheet, students investigate the changes in temperature when an alkali is neutralized by an acid. Students graph their results from the titration and draw 2 best fit lines on their graph. Where the lines...
Curated OER
Concept: Points on a Grid
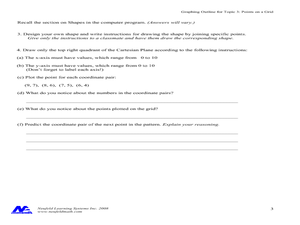
In this coordinate grid graphing worksheet, students play a game of Battleship on the computer. They answer 21 questions about the coordinate grid and graphing.
Mathematics TEKS Toolkit
Grade 6: Exploring c/d = pi
Introduce your math class to the perimeter of a circle. Teach them that pi describes the relationship between the circumference and the diameter. As a hands-on investigation, pairs or small groups use string to compare these two values...
Curated OER
Shell Graphing
Fifth graders explore the four quadrants of a coordinate grid. In this graphing lesson plan, 5th graders trace sea shells in each of the four quadrants of a coordinate grid and then label the ordered pairs on each shell. For the final...
Curated OER
Shake It Up with Scatterplots
Students identify how to use a scatterplot to compare two sets of data to determine if they are related. Then they identify and describe the definition of regression line (the "line of best fit"). Students also identify how scientists...


